RSI Donchian Channel [DCAUT]█ RSI Donchian Channel
📊 ORIGINALITY & INNOVATION
The RSI Donchian Channel represents an important synthesis of two complementary analytical frameworks: momentum oscillators and breakout detection systems. This indicator addresses a common limitation in traditional RSI analysis by replacing fixed overbought/oversold thresholds with adaptive zones derived from historical RSI extremes.
Key Enhancement:
Traditional RSI analysis relies on static threshold levels (typically 30/70), which may not adequately reflect changing market volatility regimes. This indicator adapts the reference zones dynamically based on the actual RSI behavior over the lookback period, helping traders identify meaningful momentum extremes relative to recent price action rather than arbitrary fixed levels.
The implementation combines the proven momentum measurement capabilities of RSI with Donchian Channel's breakout detection methodology, creating a framework that identifies both momentum exhaustion points and potential continuation signals through the same analytical lens.
📐 MATHEMATICAL FOUNDATION
Core Calculation Process:
Step 1: RSI Calculation
The Relative Strength Index measures momentum by comparing the magnitude of recent gains to recent losses:
Calculate price changes between consecutive periods
Separate positive changes (gains) from negative changes (losses)
Apply selected smoothing method (RMA standard, also supports SMA, EMA, WMA) to both gain and loss series
Compute Relative Strength (RS) as the ratio of smoothed gains to smoothed losses
Transform RS into bounded 0-100 scale using the formula: RSI = 100 - (100 / (1 + RS))
Step 2: Donchian Channel Application
The Donchian Channel identifies the highest and lowest RSI values within the specified lookback period:
Upper Channel: Highest RSI value over the lookback period, represents the recent momentum peak
Lower Channel: Lowest RSI value over the lookback period, represents the recent momentum trough
Middle Channel (Basis): Average of upper and lower channels, serves as equilibrium reference
Channel Width Dynamics:
The distance between upper and lower channels reflects RSI volatility. Wide channels indicate high momentum variability, while narrow channels suggest momentum consolidation and potential breakout preparation. The indicator monitors channel width over a 100-period window to identify squeeze conditions that often precede significant momentum shifts.
📊 COMPREHENSIVE SIGNAL ANALYSIS
Primary Signal Categories:
Breakout Signals:
Upper Breakout: RSI crosses above the upper channel, indicates momentum reaching new relative highs and potential trend continuation, particularly significant when accompanied by price confirmation
Lower Breakout: RSI crosses below the lower channel, suggests momentum reaching new relative lows and potential trend exhaustion or reversal setup
Breakout strength is enhanced when the channel is narrow prior to the breakout, indicating a transition from consolidation to directional movement
Mean Reversion Signals:
Upper Touch Without Breakout: RSI reaches the upper channel but fails to break through, may indicate momentum exhaustion and potential reversal opportunity
Lower Touch Without Breakout: RSI reaches the lower channel without breakdown, suggests potential bounce as momentum reaches oversold extremes
Return to Basis: RSI moving back toward the middle channel after touching extremes signals momentum normalization
Trend Strength Assessment:
Sustained Upper Channel Riding: RSI consistently remains near or above the upper channel during strong uptrends, indicates persistent bullish momentum
Sustained Lower Channel Riding: RSI stays near or below the lower channel during strong downtrends, reflects persistent bearish pressure
Basis Line Position: RSI position relative to the middle channel helps identify the prevailing momentum bias
Channel Compression Patterns:
Squeeze Detection: Channel width narrowing to 100-period lows indicates momentum consolidation, often precedes significant directional moves
Expansion Phase: Channel widening after a squeeze confirms the initiation of a new momentum regime
Persistent Narrow Channels: Extended periods of tight channels suggest market indecision and accumulation/distribution phases
🎯 STRATEGIC APPLICATIONS
Trend Continuation Strategy:
This approach focuses on identifying and trading momentum breakouts that confirm established trends:
Identify the prevailing price trend using higher timeframe analysis or trend-following indicators
Wait for RSI to break above the upper channel in uptrends (or below the lower channel in downtrends)
Enter positions in the direction of the breakout when price action confirms the momentum shift
Place protective stops below the recent swing low (long positions) or above swing high (short positions)
Target profit levels based on prior swing extremes or use trailing stops to capture extended moves
Exit when RSI crosses back through the basis line in the opposite direction
Mean Reversion Strategy:
This method capitalizes on momentum extremes and subsequent corrections toward equilibrium:
Monitor for RSI reaching the upper or lower channel boundaries
Look for rejection signals (price reversal patterns, volume divergence) when RSI touches the channels
Enter counter-trend positions when RSI begins moving back toward the basis line
Use the basis line as the initial profit target for mean reversion trades
Implement tight stops beyond the channel extremes to limit risk on failed reversals
Scale out of positions as RSI approaches the basis line and closes the position when RSI crosses the basis
Breakout Preparation Strategy:
This approach positions traders ahead of potential volatility expansion from consolidation phases:
Identify squeeze conditions when channel width reaches 100-period lows
Monitor price action for consolidation patterns (triangles, rectangles, flags) during the squeeze
Prepare conditional orders for breakouts in both directions from the consolidation
Enter positions when RSI breaks out of the narrow channel with expanding width
Use the channel width expansion as a confirmation signal for the breakout's validity
Manage risk with stops just inside the opposite channel boundary
Multi-Timeframe Confluence Strategy:
Combining RSI Donchian Channel analysis across multiple timeframes can improve signal reliability:
Identify the primary trend direction using a higher timeframe RSI Donchian Channel (e.g., daily or weekly)
Use a lower timeframe (e.g., 4-hour or hourly) to time precise entry points
Enter long positions when both timeframes show RSI above their respective basis lines
Enter short positions when both timeframes show RSI below their respective basis lines
Avoid trades when timeframes provide conflicting signals (e.g., higher timeframe below basis, lower timeframe above)
Exit when the higher timeframe RSI crosses its basis line in the opposite direction
Risk Management Guidelines:
Effective risk management is essential for all RSI Donchian Channel strategies:
Position Sizing: Calculate position sizes based on the distance between entry point and stop loss, limiting risk to 1-2% of capital per trade
Stop Loss Placement: For breakout trades, place stops just inside the opposite channel boundary; for mean reversion trades, use stops beyond the channel extremes
Profit Targets: Use the basis line as a minimum target for mean reversion trades; for trend trades, target prior swing extremes or use trailing stops
Channel Width Context: Increase position sizes during narrow channels (lower volatility) and reduce sizes during wide channels (higher volatility)
Correlation Awareness: Monitor correlations between traded instruments to avoid over-concentration in similar setups
📋 DETAILED PARAMETER CONFIGURATION
RSI Source:
Defines the price data series used for RSI calculation:
Close (Default): Standard choice providing end-of-period momentum assessment, suitable for most trading styles and timeframes
High-Low Average (HL2): Reduces the impact of closing auction dynamics, useful for markets with significant end-of-day volatility
High-Low-Close Average (HLC3): Provides a more balanced view incorporating the entire period's range
Open-High-Low-Close Average (OHLC4): Offers the most comprehensive price representation, helpful for identifying overall period sentiment
Strategy Consideration: Use Close for end-of-period signals, HL2 or HLC3 for intraday volatility reduction, OHLC4 for capturing full period dynamics
RSI Length:
Controls the number of periods used for RSI calculation:
Short Periods (5-9): Highly responsive to recent price changes, produces more frequent signals with increased false signal risk, suitable for short-term trading and volatile markets
Standard Period (14): Widely accepted default balancing responsiveness with stability, appropriate for swing trading and intermediate-term analysis
Long Periods (21-28): Produces smoother RSI with fewer signals but more reliable trend identification, better for position trading and reducing noise in choppy markets
Optimization Approach: Test different lengths against historical data for your specific market and timeframe, consider using longer periods in ranging markets and shorter periods in trending markets
RSI MA Type:
Determines the smoothing method applied to price changes in RSI calculation:
RMA (Relative Moving Average - Default): Wilder's original smoothing method providing stable momentum measurement with gradual response to changes, maintains consistency with classical RSI interpretation
SMA (Simple Moving Average): Treats all periods equally, responds more quickly to changes than RMA but may produce more whipsaws in volatile conditions
EMA (Exponential Moving Average): Weights recent periods more heavily, increases responsiveness at the cost of potential noise, suitable for traders prioritizing early signal generation
WMA (Weighted Moving Average): Applies linear weighting favoring recent data, offers a middle ground between SMA and EMA responsiveness
Selection Guidance: Maintain RMA for consistency with traditional RSI analysis, use EMA or WMA for more responsive signals in fast-moving markets, apply SMA for maximum simplicity and transparency
DC Length:
Specifies the lookback period for Donchian Channel calculation on RSI values:
Short Periods (10-14): Creates tight channels that adapt quickly to changing momentum conditions, generates more frequent trading signals but increases sensitivity to short-term RSI fluctuations
Standard Period (20): Balances channel responsiveness with stability, aligns with traditional Bollinger Bands and moving average periods, suitable for most trading styles
Long Periods (30-50): Produces wider, more stable channels that better represent sustained momentum extremes, reduces signal frequency while improving reliability, appropriate for position traders and higher timeframes
Calibration Strategy: Match DC length to your trading timeframe (shorter for day trading, longer for swing trading), test channel width behavior during different market regimes, consider using adaptive periods that adjust to volatility conditions
Market Adaptation: Use shorter DC lengths in trending markets to capture momentum shifts earlier, apply longer periods in ranging markets to filter noise and focus on significant extremes
Parameter Combination Recommendations:
Scalping/Day Trading: RSI Length 5-9, DC Length 10-14, EMA or WMA smoothing for maximum responsiveness
Swing Trading: RSI Length 14, DC Length 20, RMA smoothing for balanced analysis (default configuration)
Position Trading: RSI Length 21-28, DC Length 30-50, RMA or SMA smoothing for stable signals
High Volatility Markets: Longer RSI periods (21+) with standard DC length (20) to reduce noise
Low Volatility Markets: Standard RSI length (14) with shorter DC length (10-14) to capture subtle momentum shifts
📈 PERFORMANCE ANALYSIS & COMPETITIVE ADVANTAGES
Adaptive Threshold Mechanism:
Unlike traditional RSI analysis with fixed 30/70 thresholds, this indicator's Donchian Channel approach provides several improvements:
Context-Aware Extremes: Overbought/oversold levels adjust automatically based on recent momentum behavior rather than arbitrary fixed values
Volatility Adaptation: In low volatility periods, channels narrow to reflect tighter momentum ranges; in high volatility, channels widen appropriately
Market Regime Recognition: The indicator implicitly adapts to different market conditions without manual threshold adjustments
False Signal Reduction: Adaptive channels help reduce premature reversal signals that often occur with fixed thresholds during strong trends
Signal Quality Characteristics:
The indicator's dual-purpose design provides distinct advantages for different trading objectives:
Breakout Trading: Channel boundaries offer clear, objective breakout levels that update dynamically, eliminating the ambiguity of when momentum becomes "too high" or "too low"
Mean Reversion: The basis line provides a natural profit target for reversion trades, representing the midpoint of recent momentum extremes
Trend Strength: Persistent channel boundary riding offers an objective measure of trend strength without additional indicators
Consolidation Detection: Channel width analysis provides early warning of potential volatility expansion from compression phases
Comparative Analysis:
When compared to traditional RSI implementations and other momentum frameworks:
vs. Fixed Threshold RSI: Provides market-adaptive reference levels rather than static values, helping to reduce false signals during trending markets where RSI can remain "overbought" or "oversold" for extended periods
vs. RSI Bollinger Bands: Offers clearer breakout signals and more intuitive extreme identification through actual high/low boundaries rather than statistical standard deviations
vs. Stochastic Oscillator: Maintains RSI's momentum measurement advantages (unbounded calculation avoiding scale compression) while adding the breakout detection capabilities of Donchian Channels
vs. Standard Donchian Channels: Applies breakout methodology to momentum space rather than price, providing earlier signals of potential trend changes before price breakouts occur
Performance Characteristics:
The indicator exhibits specific behavioral patterns across different market conditions:
Trending Markets: Excels at identifying momentum continuation through channel breakouts, RSI tends to ride one channel boundary during strong trends, providing trend confirmation
Ranging Markets: Channel width narrows during consolidation, offering early preparation signals for potential breakout trading opportunities
High Volatility: Channels widen to reflect increased momentum variability, automatically adjusting signal sensitivity to match market conditions
Low Volatility: Channels contract, making the indicator more sensitive to subtle momentum shifts that may be significant in calm market environments
Transition Periods: Channel squeezes often precede major trend changes, offering advance warning of potential regime shifts
Limitations and Considerations:
Users should be aware of certain operational characteristics:
Lookback Dependency: Channel boundaries depend entirely on the lookback period, meaning the indicator has no predictive element beyond identifying current momentum relative to recent history
Lag Characteristics: As with all moving average-based indicators, RSI calculation introduces lag, and channel boundaries update only as new extremes occur within the lookback window
Range-Bound Sensitivity: In extremely tight ranges, channels may become very narrow, potentially generating excessive signals from minor momentum fluctuations
Trending Persistence: During very strong trends, RSI may remain at channel extremes for extended periods, requiring patience for mean reversion setups or commitment to trend-following approaches
No Absolute Levels: Unlike traditional RSI, this indicator provides no fixed reference points (like 50), making it less suitable for strategies that depend on absolute momentum readings
USAGE NOTES
This indicator is designed for technical analysis and educational purposes to help traders understand momentum dynamics and identify potential trading opportunities. The RSI Donchian Channel has limitations and should not be used as the sole basis for trading decisions.
Important considerations:
Performance varies significantly across different market conditions, timeframes, and instruments
Historical signal patterns do not guarantee future results, as market behavior continuously evolves
Effective use requires understanding of both RSI momentum principles and Donchian Channel breakout concepts
Risk management practices (stop losses, position sizing, diversification) are essential for any trading application
Consider combining with additional analytical tools such as volume analysis, price action patterns, or trend indicators for confirmation
Backtest thoroughly on your specific instruments and timeframes before live trading implementation
Be aware that optimization on historical data may lead to curve-fitting and poor forward performance
The indicator performs best when used as part of a comprehensive trading methodology that incorporates multiple forms of market analysis, sound risk management, and realistic expectations about win rates and drawdowns.
스크립트에서 "stop loss"에 대해 찾기

Kelly Position Size CalculatorThis position sizing calculator implements the Kelly Criterion, developed by John L. Kelly Jr. at Bell Laboratories in 1956, to determine mathematically optimal position sizes for maximizing long-term wealth growth. Unlike arbitrary position sizing methods, this tool provides a scientifically solution based on your strategy's actual performance statistics and incorporates modern refinements from over six decades of academic research.
The Kelly Criterion addresses a fundamental question in capital allocation: "What fraction of capital should be allocated to each opportunity to maximize growth while avoiding ruin?" This question has profound implications for financial markets, where traders and investors constantly face decisions about optimal capital allocation (Van Tharp, 2007).
Theoretical Foundation
The Kelly Criterion for binary outcomes is expressed as f* = (bp - q) / b, where f* represents the optimal fraction of capital to allocate, b denotes the risk-reward ratio, p indicates the probability of success, and q represents the probability of loss (Kelly, 1956). This formula maximizes the expected logarithm of wealth, ensuring maximum long-term growth rate while avoiding the risk of ruin.
The mathematical elegance of Kelly's approach lies in its derivation from information theory. Kelly's original work was motivated by Claude Shannon's information theory (Shannon, 1948), recognizing that maximizing the logarithm of wealth is equivalent to maximizing the rate of information transmission. This connection between information theory and wealth accumulation provides a deep theoretical foundation for optimal position sizing.
The logarithmic utility function underlying the Kelly Criterion naturally embodies several desirable properties for capital management. It exhibits decreasing marginal utility, penalizes large losses more severely than it rewards equivalent gains, and focuses on geometric rather than arithmetic mean returns, which is appropriate for compounding scenarios (Thorp, 2006).
Scientific Implementation
This calculator extends beyond basic Kelly implementation by incorporating state of the art refinements from academic research:
Parameter Uncertainty Adjustment: Following Michaud (1989), the implementation applies Bayesian shrinkage to account for parameter estimation error inherent in small sample sizes. The adjustment formula f_adjusted = f_kelly × confidence_factor + f_conservative × (1 - confidence_factor) addresses the overconfidence bias documented by Baker and McHale (2012), where the confidence factor increases with sample size and the conservative estimate equals 0.25 (quarter Kelly).
Sample Size Confidence: The reliability of Kelly calculations depends critically on sample size. Research by Browne and Whitt (1996) provides theoretical guidance on minimum sample requirements, suggesting that at least 30 independent observations are necessary for meaningful parameter estimates, with 100 or more trades providing reliable estimates for most trading strategies.
Universal Asset Compatibility: The calculator employs intelligent asset detection using TradingView's built-in symbol information, automatically adapting calculations for different asset classes without manual configuration.
ASSET SPECIFIC IMPLEMENTATION
Equity Markets: For stocks and ETFs, position sizing follows the calculation Shares = floor(Kelly Fraction × Account Size / Share Price). This straightforward approach reflects whole share constraints while accommodating fractional share trading capabilities.
Foreign Exchange Markets: Forex markets require lot-based calculations following Lot Size = Kelly Fraction × Account Size / (100,000 × Base Currency Value). The calculator automatically handles major currency pairs with appropriate pip value calculations, following industry standards described by Archer (2010).
Futures Markets: Futures position sizing accounts for leverage and margin requirements through Contracts = floor(Kelly Fraction × Account Size / Margin Requirement). The calculator estimates margin requirements as a percentage of contract notional value, with specific adjustments for micro-futures contracts that have smaller sizes and reduced margin requirements (Kaufman, 2013).
Index and Commodity Markets: These markets combine characteristics of both equity and futures markets. The calculator automatically detects whether instruments are cash-settled or futures-based, applying appropriate sizing methodologies with correct point value calculations.
Risk Management Integration
The calculator integrates sophisticated risk assessment through two primary modes:
Stop Loss Integration: When fixed stop-loss levels are defined, risk calculation follows Risk per Trade = Position Size × Stop Loss Distance. This ensures that the Kelly fraction accounts for actual risk exposure rather than theoretical maximum loss, with stop-loss distance measured in appropriate units for each asset class.
Strategy Drawdown Assessment: For discretionary exit strategies, risk estimation uses maximum historical drawdown through Risk per Trade = Position Value × (Maximum Drawdown / 100). This approach assumes that individual trade losses will not exceed the strategy's historical maximum drawdown, providing a reasonable estimate for strategies with well-defined risk characteristics.
Fractional Kelly Approaches
Pure Kelly sizing can produce substantial volatility, leading many practitioners to adopt fractional Kelly approaches. MacLean, Sanegre, Zhao, and Ziemba (2004) analyze the trade-offs between growth rate and volatility, demonstrating that half-Kelly typically reduces volatility by approximately 75% while sacrificing only 25% of the growth rate.
The calculator provides three primary Kelly modes to accommodate different risk preferences and experience levels. Full Kelly maximizes growth rate while accepting higher volatility, making it suitable for experienced practitioners with strong risk tolerance and robust capital bases. Half Kelly offers a balanced approach popular among professional traders, providing optimal risk-return balance by reducing volatility significantly while maintaining substantial growth potential. Quarter Kelly implements a conservative approach with low volatility, recommended for risk-averse traders or those new to Kelly methodology who prefer gradual introduction to optimal position sizing principles.
Empirical Validation and Performance
Extensive academic research supports the theoretical advantages of Kelly sizing. Hakansson and Ziemba (1995) provide a comprehensive review of Kelly applications in finance, documenting superior long-term performance across various market conditions and asset classes. Estrada (2008) analyzes Kelly performance in international equity markets, finding that Kelly-based strategies consistently outperform fixed position sizing approaches over extended periods across 19 developed markets over a 30-year period.
Several prominent investment firms have successfully implemented Kelly-based position sizing. Pabrai (2007) documents the application of Kelly principles at Berkshire Hathaway, noting Warren Buffett's concentrated portfolio approach aligns closely with Kelly optimal sizing for high-conviction investments. Quantitative hedge funds, including Renaissance Technologies and AQR, have incorporated Kelly-based risk management into their systematic trading strategies.
Practical Implementation Guidelines
Successful Kelly implementation requires systematic application with attention to several critical factors:
Parameter Estimation: Accurate parameter estimation represents the greatest challenge in practical Kelly implementation. Brown (1976) notes that small errors in probability estimates can lead to significant deviations from optimal performance. The calculator addresses this through Bayesian adjustments and confidence measures.
Sample Size Requirements: Users should begin with conservative fractional Kelly approaches until achieving sufficient historical data. Strategies with fewer than 30 trades may produce unreliable Kelly estimates, regardless of adjustments. Full confidence typically requires 100 or more independent trade observations.
Market Regime Considerations: Parameters that accurately describe historical performance may not reflect future market conditions. Ziemba (2003) recommends regular parameter updates and conservative adjustments when market conditions change significantly.
Professional Features and Customization
The calculator provides comprehensive customization options for professional applications:
Multiple Color Schemes: Eight professional color themes (Gold, EdgeTools, Behavioral, Quant, Ocean, Fire, Matrix, Arctic) with dark and light theme compatibility ensure optimal visibility across different trading environments.
Flexible Display Options: Adjustable table size and position accommodate various chart layouts and user preferences, while maintaining analytical depth and clarity.
Comprehensive Results: The results table presents essential information including asset specifications, strategy statistics, Kelly calculations, sample confidence measures, position values, risk assessments, and final position sizes in appropriate units for each asset class.
Limitations and Considerations
Like any analytical tool, the Kelly Criterion has important limitations that users must understand:
Stationarity Assumption: The Kelly Criterion assumes that historical strategy statistics represent future performance characteristics. Non-stationary market conditions may invalidate this assumption, as noted by Lo and MacKinlay (1999).
Independence Requirement: Each trade should be independent to avoid correlation effects. Many trading strategies exhibit serial correlation in returns, which can affect optimal position sizing and may require adjustments for portfolio applications.
Parameter Sensitivity: Kelly calculations are sensitive to parameter accuracy. Regular calibration and conservative approaches are essential when parameter uncertainty is high.
Transaction Costs: The implementation incorporates user-defined transaction costs but assumes these remain constant across different position sizes and market conditions, following Ziemba (2003).
Advanced Applications and Extensions
Multi-Asset Portfolio Considerations: While this calculator optimizes individual position sizes, portfolio-level applications require additional considerations for correlation effects and aggregate risk management. Simplified portfolio approaches include treating positions independently with correlation adjustments.
Behavioral Factors: Behavioral finance research reveals systematic biases that can interfere with Kelly implementation. Kahneman and Tversky (1979) document loss aversion, overconfidence, and other cognitive biases that lead traders to deviate from optimal strategies. Successful implementation requires disciplined adherence to calculated recommendations.
Time-Varying Parameters: Advanced implementations may incorporate time-varying parameter models that adjust Kelly recommendations based on changing market conditions, though these require sophisticated econometric techniques and substantial computational resources.
Comprehensive Usage Instructions and Practical Examples
Implementation begins with loading the calculator on your desired trading instrument's chart. The system automatically detects asset type across stocks, forex, futures, and cryptocurrency markets while extracting current price information. Navigation to the indicator settings allows input of your specific strategy parameters.
Strategy statistics configuration requires careful attention to several key metrics. The win rate should be calculated from your backtest results using the formula of winning trades divided by total trades multiplied by 100. Average win represents the sum of all profitable trades divided by the number of winning trades, while average loss calculates the sum of all losing trades divided by the number of losing trades, entered as a positive number. The total historical trades parameter requires the complete number of trades in your backtest, with a minimum of 30 trades recommended for basic functionality and 100 or more trades optimal for statistical reliability. Account size should reflect your available trading capital, specifically the risk capital allocated for trading rather than total net worth.
Risk management configuration adapts to your specific trading approach. The stop loss setting should be enabled if you employ fixed stop-loss exits, with the stop loss distance specified in appropriate units depending on the asset class. For stocks, this distance is measured in dollars, for forex in pips, and for futures in ticks. When stop losses are not used, the maximum strategy drawdown percentage from your backtest provides the risk assessment baseline. Kelly mode selection offers three primary approaches: Full Kelly for aggressive growth with higher volatility suitable for experienced practitioners, Half Kelly for balanced risk-return optimization popular among professional traders, and Quarter Kelly for conservative approaches with reduced volatility.
Display customization ensures optimal integration with your trading environment. Eight professional color themes provide optimization for different chart backgrounds and personal preferences. Table position selection allows optimal placement within your chart layout, while table size adjustment ensures readability across different screen resolutions and viewing preferences.
Detailed Practical Examples
Example 1: SPY Swing Trading Strategy
Consider a professionally developed swing trading strategy for SPY (S&P 500 ETF) with backtesting results spanning 166 total trades. The strategy achieved 110 winning trades, representing a 66.3% win rate, with an average winning trade of $2,200 and average losing trade of $862. The maximum drawdown reached 31.4% during the testing period, and the available trading capital amounts to $25,000. This strategy employs discretionary exits without fixed stop losses.
Implementation requires loading the calculator on the SPY daily chart and configuring the parameters accordingly. The win rate input receives 66.3, while average win and loss inputs receive 2200 and 862 respectively. Total historical trades input requires 166, with account size set to 25000. The stop loss function remains disabled due to the discretionary exit approach, with maximum strategy drawdown set to 31.4%. Half Kelly mode provides the optimal balance between growth and risk management for this application.
The calculator generates several key outputs for this scenario. The risk-reward ratio calculates automatically to 2.55, while the Kelly fraction reaches approximately 53% before scientific adjustments. Sample confidence achieves 100% given the 166 trades providing high statistical confidence. The recommended position settles at approximately 27% after Half Kelly and Bayesian adjustment factors. Position value reaches approximately $6,750, translating to 16 shares at a $420 SPY price. Risk per trade amounts to approximately $2,110, representing 31.4% of position value, with expected value per trade reaching approximately $1,466. This recommendation represents the mathematically optimal balance between growth potential and risk management for this specific strategy profile.
Example 2: EURUSD Day Trading with Stop Losses
A high-frequency EURUSD day trading strategy demonstrates different parameter requirements compared to swing trading approaches. This strategy encompasses 89 total trades with a 58% win rate, generating an average winning trade of $180 and average losing trade of $95. The maximum drawdown reached 12% during testing, with available capital of $10,000. The strategy employs fixed stop losses at 25 pips and take profit targets at 45 pips, providing clear risk-reward parameters.
Implementation begins with loading the calculator on the EURUSD 1-hour chart for appropriate timeframe alignment. Parameter configuration includes win rate at 58, average win at 180, and average loss at 95. Total historical trades input receives 89, with account size set to 10000. The stop loss function is enabled with distance set to 25 pips, reflecting the fixed exit strategy. Quarter Kelly mode provides conservative positioning due to the smaller sample size compared to the previous example.
Results demonstrate the impact of smaller sample sizes on Kelly calculations. The risk-reward ratio calculates to 1.89, while the Kelly fraction reaches approximately 32% before adjustments. Sample confidence achieves 89%, providing moderate statistical confidence given the 89 trades. The recommended position settles at approximately 7% after Quarter Kelly application and Bayesian shrinkage adjustment for the smaller sample. Position value amounts to approximately $700, translating to 0.07 standard lots. Risk per trade reaches approximately $175, calculated as 25 pips multiplied by lot size and pip value, with expected value per trade at approximately $49. This conservative position sizing reflects the smaller sample size, with position sizes expected to increase as trade count surpasses 100 and statistical confidence improves.
Example 3: ES1! Futures Systematic Strategy
Systematic futures trading presents unique considerations for Kelly criterion application, as demonstrated by an E-mini S&P 500 futures strategy encompassing 234 total trades. This systematic approach achieved a 45% win rate with an average winning trade of $1,850 and average losing trade of $720. The maximum drawdown reached 18% during the testing period, with available capital of $50,000. The strategy employs 15-tick stop losses with contract specifications of $50 per tick, providing precise risk control mechanisms.
Implementation involves loading the calculator on the ES1! 15-minute chart to align with the systematic trading timeframe. Parameter configuration includes win rate at 45, average win at 1850, and average loss at 720. Total historical trades receives 234, providing robust statistical foundation, with account size set to 50000. The stop loss function is enabled with distance set to 15 ticks, reflecting the systematic exit methodology. Half Kelly mode balances growth potential with appropriate risk management for futures trading.
Results illustrate how favorable risk-reward ratios can support meaningful position sizing despite lower win rates. The risk-reward ratio calculates to 2.57, while the Kelly fraction reaches approximately 16%, lower than previous examples due to the sub-50% win rate. Sample confidence achieves 100% given the 234 trades providing high statistical confidence. The recommended position settles at approximately 8% after Half Kelly adjustment. Estimated margin per contract amounts to approximately $2,500, resulting in a single contract allocation. Position value reaches approximately $2,500, with risk per trade at $750, calculated as 15 ticks multiplied by $50 per tick. Expected value per trade amounts to approximately $508. Despite the lower win rate, the favorable risk-reward ratio supports meaningful position sizing, with single contract allocation reflecting appropriate leverage management for futures trading.
Example 4: MES1! Micro-Futures for Smaller Accounts
Micro-futures contracts provide enhanced accessibility for smaller trading accounts while maintaining identical strategy characteristics. Using the same systematic strategy statistics from the previous example but with available capital of $15,000 and micro-futures specifications of $5 per tick with reduced margin requirements, the implementation demonstrates improved position sizing granularity.
Kelly calculations remain identical to the full-sized contract example, maintaining the same risk-reward dynamics and statistical foundations. However, estimated margin per contract reduces to approximately $250 for micro-contracts, enabling allocation of 4-5 micro-contracts. Position value reaches approximately $1,200, while risk per trade calculates to $75, derived from 15 ticks multiplied by $5 per tick. This granularity advantage provides better position size precision for smaller accounts, enabling more accurate Kelly implementation without requiring large capital commitments.
Example 5: Bitcoin Swing Trading
Cryptocurrency markets present unique challenges requiring modified Kelly application approaches. A Bitcoin swing trading strategy on BTCUSD encompasses 67 total trades with a 71% win rate, generating average winning trades of $3,200 and average losing trades of $1,400. Maximum drawdown reached 28% during testing, with available capital of $30,000. The strategy employs technical analysis for exits without fixed stop losses, relying on price action and momentum indicators.
Implementation requires conservative approaches due to cryptocurrency volatility characteristics. Quarter Kelly mode is recommended despite the high win rate to account for crypto market unpredictability. Expected position sizing remains reduced due to the limited sample size of 67 trades, requiring additional caution until statistical confidence improves. Regular parameter updates are strongly recommended due to cryptocurrency market evolution and changing volatility patterns that can significantly impact strategy performance characteristics.
Advanced Usage Scenarios
Portfolio position sizing requires sophisticated consideration when running multiple strategies simultaneously. Each strategy should have its Kelly fraction calculated independently to maintain mathematical integrity. However, correlation adjustments become necessary when strategies exhibit related performance patterns. Moderately correlated strategies should receive individual position size reductions of 10-20% to account for overlapping risk exposure. Aggregate portfolio risk monitoring ensures total exposure remains within acceptable limits across all active strategies. Professional practitioners often consider using lower fractional Kelly approaches, such as Quarter Kelly, when running multiple strategies simultaneously to provide additional safety margins.
Parameter sensitivity analysis forms a critical component of professional Kelly implementation. Regular validation procedures should include monthly parameter updates using rolling 100-trade windows to capture evolving market conditions while maintaining statistical relevance. Sensitivity testing involves varying win rates by ±5% and average win/loss ratios by ±10% to assess recommendation stability under different parameter assumptions. Out-of-sample validation reserves 20% of historical data for parameter verification, ensuring that optimization doesn't create curve-fitted results. Regime change detection monitors actual performance against expected metrics, triggering parameter reassessment when significant deviations occur.
Risk management integration requires professional overlay considerations beyond pure Kelly calculations. Daily loss limits should cease trading when daily losses exceed twice the calculated risk per trade, preventing emotional decision-making during adverse periods. Maximum position limits should never exceed 25% of account value in any single position regardless of Kelly recommendations, maintaining diversification principles. Correlation monitoring reduces position sizes when holding multiple correlated positions that move together during market stress. Volatility adjustments consider reducing position sizes during periods of elevated VIX above 25 for equity strategies, adapting to changing market conditions.
Troubleshooting and Optimization
Professional implementation often encounters specific challenges requiring systematic troubleshooting approaches. Zero position size displays typically result from insufficient capital for minimum position sizes, negative expected values, or extremely conservative Kelly calculations. Solutions include increasing account size, verifying strategy statistics for accuracy, considering Quarter Kelly mode for conservative approaches, or reassessing overall strategy viability when fundamental issues exist.
Extremely high Kelly fractions exceeding 50% usually indicate underlying problems with parameter estimation. Common causes include unrealistic win rates, inflated risk-reward ratios, or curve-fitted backtest results that don't reflect genuine trading conditions. Solutions require verifying backtest methodology, including all transaction costs in calculations, testing strategies on out-of-sample data, and using conservative fractional Kelly approaches until parameter reliability improves.
Low sample confidence below 50% reflects insufficient historical trades for reliable parameter estimation. This situation demands gathering additional trading data, using Quarter Kelly approaches until reaching 100 or more trades, applying extra conservatism in position sizing, and considering paper trading to build statistical foundations without capital risk.
Inconsistent results across similar strategies often stem from parameter estimation differences, market regime changes, or strategy degradation over time. Professional solutions include standardizing backtest methodology across all strategies, updating parameters regularly to reflect current conditions, and monitoring live performance against expectations to identify deteriorating strategies.
Position sizes that appear inappropriately large or small require careful validation against traditional risk management principles. Professional standards recommend never risking more than 2-3% per trade regardless of Kelly calculations. Calibration should begin with Quarter Kelly approaches, gradually increasing as comfort and confidence develop. Most institutional traders utilize 25-50% of full Kelly recommendations to balance growth with prudent risk management.
Market condition adjustments require dynamic approaches to Kelly implementation. Trending markets may support full Kelly recommendations when directional momentum provides favorable conditions. Ranging or volatile markets typically warrant reducing to Half or Quarter Kelly to account for increased uncertainty. High correlation periods demand reducing individual position sizes when multiple positions move together, concentrating risk exposure. News and event periods often justify temporary position size reductions during high-impact releases that can create unpredictable market movements.
Performance monitoring requires systematic protocols to ensure Kelly implementation remains effective over time. Weekly reviews should compare actual versus expected win rates and average win/loss ratios to identify parameter drift or strategy degradation. Position size efficiency and execution quality monitoring ensures that calculated recommendations translate effectively into actual trading results. Tracking correlation between calculated and realized risk helps identify discrepancies between theoretical and practical risk exposure.
Monthly calibration provides more comprehensive parameter assessment using the most recent 100 trades to maintain statistical relevance while capturing current market conditions. Kelly mode appropriateness requires reassessment based on recent market volatility and performance characteristics, potentially shifting between Full, Half, and Quarter Kelly approaches as conditions change. Transaction cost evaluation ensures that commission structures, spreads, and slippage estimates remain accurate and current.
Quarterly strategic reviews encompass comprehensive strategy performance analysis comparing long-term results against expectations and identifying trends in effectiveness. Market regime assessment evaluates parameter stability across different market conditions, determining whether strategy characteristics remain consistent or require fundamental adjustments. Strategic modifications to position sizing methodology may become necessary as markets evolve or trading approaches mature, ensuring that Kelly implementation continues supporting optimal capital allocation objectives.
Professional Applications
This calculator serves diverse professional applications across the financial industry. Quantitative hedge funds utilize the implementation for systematic position sizing within algorithmic trading frameworks, where mathematical precision and consistent application prove essential for institutional capital management. Professional discretionary traders benefit from optimized position management that removes emotional bias while maintaining flexibility for market-specific adjustments. Portfolio managers employ the calculator for developing risk-adjusted allocation strategies that enhance returns while maintaining prudent risk controls across diverse asset classes and investment strategies.
Individual traders seeking mathematical optimization of capital allocation find the calculator provides institutional-grade methodology previously available only to professional money managers. The Kelly Criterion establishes theoretical foundation for optimal capital allocation across both single strategies and multiple trading systems, offering significant advantages over arbitrary position sizing methods that rely on intuition or fixed percentage approaches. Professional implementation ensures consistent application of mathematically sound principles while adapting to changing market conditions and strategy performance characteristics.
Conclusion
The Kelly Criterion represents one of the few mathematically optimal solutions to fundamental investment problems. When properly understood and carefully implemented, it provides significant competitive advantage in financial markets. This calculator implements modern refinements to Kelly's original formula while maintaining accessibility for practical trading applications.
Success with Kelly requires ongoing learning, systematic application, and continuous refinement based on market feedback and evolving research. Users who master Kelly principles and implement them systematically can expect superior risk-adjusted returns and more consistent capital growth over extended periods.
The extensive academic literature provides rich resources for deeper study, while practical experience builds the intuition necessary for effective implementation. Regular parameter updates, conservative approaches with limited data, and disciplined adherence to calculated recommendations are essential for optimal results.
References
Archer, M. D. (2010). Getting Started in Currency Trading: Winning in Today's Forex Market (3rd ed.). John Wiley & Sons.
Baker, R. D., & McHale, I. G. (2012). An empirical Bayes approach to optimising betting strategies. Journal of the Royal Statistical Society: Series D (The Statistician), 61(1), 75-92.
Breiman, L. (1961). Optimal gambling systems for favorable games. In J. Neyman (Ed.), Proceedings of the Fourth Berkeley Symposium on Mathematical Statistics and Probability (pp. 65-78). University of California Press.
Brown, D. B. (1976). Optimal portfolio growth: Logarithmic utility and the Kelly criterion. In W. T. Ziemba & R. G. Vickson (Eds.), Stochastic Optimization Models in Finance (pp. 1-23). Academic Press.
Browne, S., & Whitt, W. (1996). Portfolio choice and the Bayesian Kelly criterion. Advances in Applied Probability, 28(4), 1145-1176.
Estrada, J. (2008). Geometric mean maximization: An overlooked portfolio approach? The Journal of Investing, 17(4), 134-147.
Hakansson, N. H., & Ziemba, W. T. (1995). Capital growth theory. In R. A. Jarrow, V. Maksimovic, & W. T. Ziemba (Eds.), Handbooks in Operations Research and Management Science (Vol. 9, pp. 65-86). Elsevier.
Kahneman, D., & Tversky, A. (1979). Prospect theory: An analysis of decision under risk. Econometrica, 47(2), 263-291.
Kaufman, P. J. (2013). Trading Systems and Methods (5th ed.). John Wiley & Sons.
Kelly Jr, J. L. (1956). A new interpretation of information rate. Bell System Technical Journal, 35(4), 917-926.
Lo, A. W., & MacKinlay, A. C. (1999). A Non-Random Walk Down Wall Street. Princeton University Press.
MacLean, L. C., Sanegre, E. O., Zhao, Y., & Ziemba, W. T. (2004). Capital growth with security. Journal of Economic Dynamics and Control, 28(4), 937-954.
MacLean, L. C., Thorp, E. O., & Ziemba, W. T. (2011). The Kelly Capital Growth Investment Criterion: Theory and Practice. World Scientific.
Michaud, R. O. (1989). The Markowitz optimization enigma: Is 'optimized' optimal? Financial Analysts Journal, 45(1), 31-42.
Pabrai, M. (2007). The Dhandho Investor: The Low-Risk Value Method to High Returns. John Wiley & Sons.
Shannon, C. E. (1948). A mathematical theory of communication. Bell System Technical Journal, 27(3), 379-423.
Tharp, V. K. (2007). Trade Your Way to Financial Freedom (2nd ed.). McGraw-Hill.
Thorp, E. O. (2006). The Kelly criterion in blackjack sports betting, and the stock market. In L. C. MacLean, E. O. Thorp, & W. T. Ziemba (Eds.), The Kelly Capital Growth Investment Criterion: Theory and Practice (pp. 789-832). World Scientific.
Van Tharp, K. (2007). Trade Your Way to Financial Freedom (2nd ed.). McGraw-Hill Education.
Vince, R. (1992). The Mathematics of Money Management: Risk Analysis Techniques for Traders. John Wiley & Sons.
Vince, R., & Zhu, H. (2015). Optimal betting under parameter uncertainty. Journal of Statistical Planning and Inference, 161, 19-31.
Ziemba, W. T. (2003). The Stochastic Programming Approach to Asset, Liability, and Wealth Management. The Research Foundation of AIMR.
Further Reading
For comprehensive understanding of Kelly Criterion applications and advanced implementations:
MacLean, L. C., Thorp, E. O., & Ziemba, W. T. (2011). The Kelly Capital Growth Investment Criterion: Theory and Practice. World Scientific.
Vince, R. (1992). The Mathematics of Money Management: Risk Analysis Techniques for Traders. John Wiley & Sons.
Thorp, E. O. (2017). A Man for All Markets: From Las Vegas to Wall Street. Random House.
Cover, T. M., & Thomas, J. A. (2006). Elements of Information Theory (2nd ed.). John Wiley & Sons.
Ziemba, W. T., & Vickson, R. G. (Eds.). (2006). Stochastic Optimization Models in Finance. World Scientific.

Alpha - Combined BreakoutThis Pine Script indicator, "Alpha - Combined Breakout," is a combination between Smart Money Breakout Signals and UT Bot Alert, The UT Bot Alert indicator was initially developer by Yo_adriiiiaan
The idea of original code belongs HPotter.
This Indicator helps you identify potential trading opportunities by combining two distinct strategies: Smart Money Breakout and a modified UT Bot (likely a variation of the Ultimate Trend Bot). It provides visual signals, draws lines for potential take profit (TP) and stop loss (SL) levels, and includes a dashboard to track performance metrics.
Tutorial:
Understanding and Using the "Alpha - Combined Breakout" Indicator
This indicator is designed for traders looking for confirmation of market direction and potential entry/exit points by blending structural analysis with a trend-following oscillator.
How it Works (General Concept)
The indicator combines two main components:
Smart Money Breakout: This part identifies significant breaks in market structure, which "smart money" traders often use to gauge shifts in supply and demand. It looks for higher highs/lows or lower highs/lows and flags when these structural points are broken.
UT Bot: This is a trend-following component that generates buy and sell signals based on price action relative to an Average True Range (ATR) based trailing stop.
You can choose to use these signals independently or combined to generate trading alerts and visual cues on your chart. The dashboard provides a quick overview of how well the signals are performing based on your chosen settings and display mode.
Parameters and What They Do
Let's break down each input parameter:
1. Smart Money Inputs
These settings control how the indicator identifies market structure and breakouts.
swingSize (Market Structure Time-Horizon):
What it does: This integer value defines the number of candles used to identify significant "swing" (pivot) points—highs and lows.
Effect: A larger swingSize creates a smoother market structure, focusing on longer-term trends. This means signals might appear less frequently and with some delay but could be more reliable for higher timeframes or broader market movements. A smaller swingSize will pick up more minor market structure changes, leading to more frequent but potentially noisier signals, suitable for lower timeframes or scalping.
Analogy: Think of it like a zoom level on your market structure map. Higher values zoom out, showing only major mountain ranges. Lower values zoom in, showing every hill and bump.
bosConfType (BOS Confirmation Type):
What it does: This string input determines how a Break of Structure (BOS) is confirmed. You have two options:
'Candle Close': A breakout is confirmed only if a candle's closing price surpasses the previous swing high (for bullish) or swing low (for bearish).
'Wicks': A breakout is confirmed if any part of the candle (including its wick) surpasses the previous swing high or low.
Effect: 'Candle Close' provides stronger, more conservative confirmation, as it implies sustained price movement beyond the structure. 'Wicks' provides earlier, more aggressive signals, as it captures momentary breaches of the structure.
Analogy: Imagine a wall. 'Candle Close' means the whole person must get over the wall. 'Wicks' means even a finger touching over the top counts as a breach.
choch (Show CHoCH):
What it does: A boolean (true/false) input to enable or disable the display of "Change of Character" (CHoCH) labels. CHoCH indicates the first structural break against the current dominant trend.
Effect: When true, it helps identify early signs of a potential trend reversal, as it marks where the market's "character" (its tendency to make higher highs/lows or lower lows/highs) first changes.
BULL (Bullish Color) & BEAR (Bearish Color):
What they do: These color inputs allow you to customize the visual appearance of bullish and bearish signals and lines drawn by the Smart Money component.
Effect: Purely cosmetic, helps with visual identification on the chart.
sm_tp_sl_multiplier (SM TP/SL Multiplier (ATR)):
What it does: A float value that acts as a multiplier for the Average True Range (ATR) to calculate the Take Profit (TP) and Stop Loss (SL) levels specifically when you're in "Smart Money Only" mode. It uses the ATR calculated by the UT Bot's nLoss_ut as its base.
Effect: A higher multiplier creates wider TP/SL levels, potentially leading to fewer trades but larger wins/losses. A lower multiplier creates tighter TP/SL levels, potentially leading to more frequent but smaller wins/losses.
2. UT Bot Alerts Inputs
These parameters control the behavior and sensitivity of the UT Bot component.
a_ut (UT Key Value (Sensitivity)):
What it does: This integer value adjusts the sensitivity of the UT Bot.
Effect: A higher value makes the UT Bot less sensitive to price fluctuations, resulting in fewer and potentially more reliable signals. A lower value makes it more sensitive, generating more signals, which can include more false signals.
Analogy: Like a noise filter. Higher values filter out more noise, keeping only strong signals.
c_ut (UT ATR Period):
What it does: This integer sets the look-back period for the Average True Range (ATR) calculation used by the UT Bot. ATR measures market volatility.
Effect: This period directly influences the calculation of the nLoss_ut (which is a_ut * xATR_ut), thus defining the distance of the trailing stop loss and take profit levels. A longer period makes the ATR smoother and less reactive to sudden price spikes. A shorter period makes it more responsive.
h_ut (UT Signals from Heikin Ashi Candles):
What it does: A boolean (true/false) input to determine if the UT Bot calculations should use standard candlestick data or Heikin Ashi candlestick data.
Effect: Heikin Ashi candles smooth out price action, often making trends clearer and reducing noise. Using them for UT Bot signals can lead to smoother, potentially delayed signals that stay with a trend longer. Standard candles are more reactive to raw price changes.
3. Line Drawing Control Buttons
These crucial boolean inputs determine which type of signals will trigger the drawing of TP/SL/Entry lines and flags on your chart. They act as a priority system.
drawLinesUtOnly (Draw Lines: UT Only):
What it does: If checked (true), lines and flags will only be drawn when the UT Bot generates a buy/sell signal.
Effect: Isolates UT Bot signals for visual analysis.
drawLinesSmartMoneyOnly (Draw Lines: Smart Money Only):
What it does: If checked (true), lines and flags will only be drawn when the Smart Money Breakout logic generates a bullish/bearish breakout.
Effect: Overrides drawLinesUtOnly if both are checked. Isolates Smart Money signals.
drawLinesCombined (Draw Lines: UT & Smart Money (Combined)):
What it does: If checked (true), lines and flags will only be drawn when both a UT Bot signal AND a Smart Money Breakout signal occur on the same bar.
Effect: Overrides both drawLinesUtOnly and drawLinesSmartMoneyOnly if checked. Provides the strictest entry criteria for line drawing, looking for strong confluence.
Dashboard Metrics Explained
The dashboard provides performance statistics based on the lines drawing control button selected. For example, if "Draw Lines: UT Only" is active, the dashboard will show stats only for UT Bot signals.
Total Signals: The total number of buy or sell signals generated by the selected drawing mode.
TP1 Win Rate: The percentage of signals where the price reached Take Profit 1 (TP1) before hitting the Stop Loss.
TP2 Win Rate: The percentage of signals where the price reached Take Profit 2 (TP2) before hitting the Stop Loss.
TP3 Win Rate: The percentage of signals where the price reached Take Profit 3 (TP3) before hitting the Stop Loss. (Note: TP1, TP2, TP3 are in order of distance from entry, with TP3 being furthest.)
SL before any TP rate: This crucial metric shows the number of times the Stop Loss was hit / the percentage of total signals where the stop loss was triggered before any of the three Take Profit levels were reached. This gives you a clear picture of how often a trade resulted in a loss without ever moving into profit target territory.
Short Tutorial: How to Use the Indicator
Add to Chart: Open your TradingView chart, go to "Indicators," search for "Alpha - Combined Breakout," and add it to your chart.
Access Settings: Once added, click the gear icon next to the indicator name on your chart to open its settings.
Choose Your Signal Mode:
For UT Bot only: Uncheck "Draw Lines: Smart Money Only" and "Draw Lines: UT & Smart Money (Combined)". Ensure "Draw Lines: UT Only" is checked.
For Smart Money only: Uncheck "Draw Lines: UT Only" and "Draw Lines: UT & Smart Money (Combined)". Ensure "Draw Lines: Smart Money Only" is checked.
For Combined Signals: Check "Draw Lines: UT & Smart Money (Combined)". This will override the other two.
Adjust Parameters:
Start with default settings. Observe how the signals appear on your chosen asset and timeframe.
Refine Smart Money: If you see too many "noisy" market structure breaks, increase swingSize. If you want earlier breakouts, try "Wicks" for bosConfType.
Refine UT Bot: Adjust a_ut (Sensitivity) to get more or fewer UT Bot signals. Change c_ut (ATR Period) if you want larger or smaller TP/SL distances. Experiment with h_ut to see if Heikin Ashi smoothing suits your trading style.
Adjust TP/SL Multiplier: If using "Smart Money Only" mode, fine-tune sm_tp_sl_multiplier to set appropriate risk/reward levels.
Interpret Signals & Lines:
Buy/Sell Flags: These indicate the presence of a signal based on your selected drawing mode.
Entry Line (Blue Solid): This is where the signal was generated (usually the close price of the signal candle).
SL Line (Red/Green Solid): Your calculated stop loss level.
TP Lines (Dashed): Your three calculated take profit levels (TP1, TP2, TP3, where TP3 is the furthest target).
Smart Money Lines (BOS/CHoCH): These lines indicate horizontal levels where market structure breaks occurred. CHoCH labels might appear at the first structural break against the prior trend.
Monitor Dashboard: Pay attention to the dashboard in the top right corner. This dynamically updates to show the win rates for each TP and, crucially, the "SL before any TP rate." Use these statistics to evaluate the effectiveness of the indicator's signals under your current settings and chosen mode.
*
Set Alerts (Optional): You can set up alerts for any of the specific signals (UT Bot Long/Short, Smart Money Bullish/Bearish, or the "Line Draw" combined signals) to notify you when they occur, even if you're not actively watching the chart.
By following this tutorial, you'll be able to effectively use and customize the "Alpha - Combined Breakout" indicator to suit your trading strategy.

(Early Test) Weekly Seasonality with Dynamic Kelly Criterion# Enhancing Trading Strategies with the Weekly Seasonality Dynamic Kelly Criterion Indicator
Amidst this pursuit to chase price, a common pitfall emerges: an overemphasis on price movements without adequate attention to risk management, probabilistic analysis, and strategic position sizing. To address these challenges, I developed the **Weekly Seasonality with Dynamic Kelly Criterion Indicator**. It is designed to refocus traders on essential aspects of trading, such as risk management and probabilistic returns, thereby catering to both short-term swing traders and long-term investors aiming for tax-efficient positions.
## The Motivation Behind the Indicator
### Overemphasis on Price: A Common Trading Pitfall
Many traders concentrate heavily on price charts and technical indicators, often neglecting the underlying principles of risk management and probabilistic analysis. This overemphasis on price can lead to:
- **Overtrading:** Making frequent trades based solely on price movements without considering the associated risks.
- **Poor Risk Management:** Failing to set appropriate stop-loss levels or position sizes, increasing the potential for significant losses.
- **Emotional Trading:** Letting emotions drive trading decisions rather than objective analysis, which can result in impulsive and irrational trades.
### The Need for Balanced Focus
To achieve sustained trading success, it is crucial to balance price analysis with robust risk management and probabilistic strategies. Key areas of focus include:
1. **Risk Management:** Implementing strategies to protect capital, such as setting stop-loss orders and determining appropriate position sizes based on risk tolerance.
2. **Probabilistic Analysis:** Assessing the likelihood of various market outcomes to make informed trading decisions.
3. **Swing Trading Percent Returns:** Capitalizing on short- to medium-term price movements by buying assets below their average return and selling them above.
## Introducing the Weekly Seasonality with Dynamic Kelly Criterion Indicator
The **Weekly Seasonality with Dynamic Kelly Criterion Indicator** is designed to integrate these essential elements into a comprehensive tool that aids traders in making informed, risk-aware decisions. Below, we explore the key components and functionalities of this indicator.
### Key Components of the Indicator
1. **Average Return (%)**
- **Definition:** The mean percentage return for each week across multiple years.
- **Purpose:** Serves as a benchmark to identify weeks with above or below-average performance, guiding buy and sell decisions.
2. **Positive Percentage (%)**
- **Definition:** The proportion of weeks that yielded positive returns.
- **Purpose:** Indicates the consistency of positive returns, helping traders gauge the reliability of certain weeks for trading.
3. **Volatility (%)**
- **Definition:** The standard deviation of weekly returns.
- **Purpose:** Measures the variability of returns, providing insights into the risk associated with trading during specific weeks.
4. **Kelly Ratio**
- **Definition:** A mathematical formula used to determine the optimal size of a series of bets to maximize the logarithmic growth of capital.
- **Purpose:** Balances potential returns against risks, guiding traders on the appropriate position size to take.
5. **Adjusted Kelly Fraction**
- **Definition:** The Kelly Ratio adjusted based on user-defined risk tolerance and external factors like Federal Reserve (Fed) stance.
- **Purpose:** Personalizes the Kelly Criterion to align with individual risk preferences and market conditions, enhancing risk management.
6. **Position Size ($)**
- **Definition:** The calculated amount to invest based on the Adjusted Kelly Fraction.
- **Purpose:** Ensures that position sizes are aligned with risk management strategies, preventing overexposure to any single trade.
7. **Max Drawdown (%)**
- **Definition:** The maximum observed loss from a peak to a trough of a portfolio, before a new peak is attained.
- **Purpose:** Assesses the worst-case scenario for losses, crucial for understanding potential capital erosion.
### Functionality and Benefits
- **Weekly Data Aggregation:** Aggregates weekly returns across multiple years to provide a robust statistical foundation for decision-making.
- **Quarterly Filtering:** Allows users to filter weeks based on quarters, enabling seasonality analysis and tailored strategies aligned with specific timeframes.
- **Dynamic Risk Adjustment:** Incorporates the Dynamic Kelly Criterion to adjust position sizes in real-time based on changing risk profiles and market conditions.
- **User-Friendly Visualization:** Presents all essential metrics in an organized Summary Table, facilitating quick and informed decision-making.
## The Origin of the Kelly Criterion and Addressing Its Limitations
### Understanding the Kelly Criterion
The Kelly Criterion, developed by John L. Kelly Jr. in 1956, is a formula used to determine the optimal size of a series of bets to maximize the long-term growth of capital. The formula considers both the probability of winning and the payout ratio, balancing potential returns against the risk of loss.
**Kelly Formula:**
\
Where:
- \( b \) = the net odds received on the wager ("b to 1")
- \( p \) = probability of winning
- \( q \) = probability of losing ( \( q = 1 - p \) )
### The Risk of Ruin
While the Kelly Criterion is effective in optimizing growth, it carries inherent risks:
- **Overbetting:** If the input probabilities or payout ratios are misestimated, the Kelly Criterion can suggest overly aggressive position sizes, leading to significant losses.
- **Assumption of Constant Probabilities:** The criterion assumes that probabilities remain constant, which is rarely the case in dynamic markets.
- **Ignoring External Factors:** Traditional Kelly implementations do not account for external factors such as Federal Reserve rates, margin requirements, or market volatility, which can impact risk and returns.
### Addressing Traditional Limitations
Recognizing these limitations, the **Weekly Seasonality with Dynamic Kelly Criterion Indicator** introduces enhancements to the traditional Kelly approach:
- **Incorporation of Fed Stance:** Adjusts the Kelly Fraction based on the current stance of the Federal Reserve (neutral, dovish, or hawkish), reflecting broader economic conditions that influence market behavior.
- **Margin and Leverage Considerations:** Accounts for margin rates and leverage, ensuring that position sizes remain within manageable risk parameters.
- **Dynamic Adjustments:** Continuously updates position sizes based on real-time risk assessments and probabilistic analyses, mitigating the risk of ruin associated with static Kelly implementations.
## How the Indicator Aids Traders
### For Short-Term Swing Traders
Short-term swing traders thrive on capitalizing over weekly price movements. The indicator aids them by:
- **Identifying Favorable Weeks:** Highlights weeks with above-average returns and favorable volatility, guiding entry and exit points.
- **Optimal Position Sizing:** Utilizes the Adjusted Kelly Fraction to determine the optimal amount to invest, balancing potential returns with risk exposure.
- **Probabilistic Insights:** Provides metrics like Positive Percentage (%) and Kelly Ratio to assess the likelihood of favorable outcomes, enhancing decision-making.
### For Long-Term Tax-Free Investors
This is effectively a drop-in replacement for DCA which uses fixed position size that doesn't change based on market conditions, as a result, it's like catching multiple falling knifes by the blade and smiling with blood on your hand... I don't know about you, but I'd rather juggle by the hilt and look like an actual professional...
Long-term investors, especially those seeking tax-free positions (e.g., through retirement accounts), benefit from:
- **Consistent Risk Management:** Ensures that position sizes are aligned with long-term capital preservation strategies.
- **Seasonality Analysis:** Allows for strategic positioning based on historical performance trends across different weeks and quarters.
- **Dynamic Adjustments:** Adapts to changing market conditions, maintaining optimal risk profiles over extended investment horizons.
### Developers
Please double check the logic and functionality because I think there are a few issue and I need to crowd source solutions and be responsible about the code I publish. If you have corrections, please DM me or leave a respectful comment.
I want to publish this by the end of the year and include other things like highlighting triple witching weeks, adding columns for volume % stats, VaR and CVaR, alpha, beta (to see the seasonal alpha and beta based off a benchmark ticker and risk free rate ticker and other little goodies.

Risk Management Tool [LuxAlgo]Good money management is one of the fundamental pillars of successful trading. With this indicator, we propose a simple way to manage trading positions. This tool shows Profit & Loss (P&L), suggests position size given a certain risk, sets stop losses and take profit levels using fixed price value/percentage/ATR/Range, and can also determine entries from crosses with technical indicators which is particularly handy if you don't want to set an entry manually.
1. Settings
Position Type: Determines if the position should be a "Long" or "Short".
Account Size: Determines the total capital of the trading account.
Risk: The maximum risk amount for a trade. Can be set as a percentage of the account size or as a fixed amount.
Entry Price: Determines the entry price of the position.
Entry From Cross: When enabled, allows to set the entry price where a cross with an external source was produced.
1.1 Stop Loss/Take Profit
Take Profit: Determines the take profit level, which can be determined by a value or percentage.
Stop Loss: Determines the stop loss level, which can be determined by a value or percentage.
2. Usage
One of the main usages of position management tools is to determine the position size to allocate given a specific risk amount and stop-loss. 2% of your capital is often recommended as a risk amount.
Our tool allows setting stop losses and take profits with different methods.
The ATR method sets the stop loss/take profit one ATR away from the entry price, with the ATR period being determined in the drop-down menu next to the selected methods. The range method works similarly but instead of using the ATR, we use a rolling range with a period determined in the drop-down menu next to the selected methods as well.
Unlike the available position management tool on TradingView, the entry can be determined from a cross between the price an an external source. The image above shows entries from the Volatility Stop indicator. This is particularly useful if you set positions based on trailing stops.

In-Range Rolling SL
In-Range Rolling SL Indicator Guide
The In-Range Rolling SL indicator is a dynamic stop-loss system designed for intraday trading that identifies squeeze conditions and trade entry opportunities based on rolling price windows.
Core Concept
The indicator analyzes the highest high and lowest low over a defined lookback period (default: 2 candles) to establish an "in-range" zone. When price stays within this range without breaking either boundary, it creates a squeeze condition—signaling potential breakout opportunities.
Trading Strategy
Wait for the Squeeze Setup
The most effective approach is to wait for the in-range stop-loss squeeze to form. This occurs when both the long SL (green line) and short SL (red line) are active simultaneously, indicated by the yellow status dot (🟡) in the indicator table. Analyze the wick high/close relationship against the in-range SL while price remains compressed—this setup identifies which side is more likely to break first.
Entry Timing and Risk Management
Long Entry: Enter when a candle closes above the in-range short SL (red line) without any wick above it. This "perfect breakout candle" confirms bullish momentum. Your entry should be around the region, with your stop-loss placed just below the top of the breakout candle's high.
Short Entry: Enter when a candle closes below the in-range long SL (green line). The stop-loss for short trades should be set 34.26 points above your entry for appropriate risk protection.
Risk-Reward Considerations
If you enter at the low of a breakout candle, expect only 8.26 points of drawdown potential. However, if you accidentally go long and your stop gets hit, you'll experience the full in-range stop-loss distance as your loss.
Advanced Techniques
Failed Breakout Trap: If a follow-up candle doesn't make a higher high after the initial breakout, consider adding a "winner" for compensation rather than holding for a trap. When your buy-stop sits on top of the breakout candle high, this isn't a valid long trade setup.
Flip Trade Opportunity: In-range stop-loss attempts to flip often provide ideal entry points. If the up candle doesn't break the previous low, this validates the long continuation.
Long Scalp Trading: A failed long scalp can be traded if you missed the initial market open down-up-down trend. With a stop-loss of 34 points and potential profit exceeding 50 points, this provides favorable risk-reward ratios.
Sustained Loss Management: Stop-loss for long positions should target 26 points maximum loss. The indicator automatically invalidates stop-losses when price violates them, keeping your chart clean for the next setup.
-------------------------
In-Range Rolling SL Indicator Guide
The In-Range Rolling SL indicator is a dynamic stop-loss system designed for intraday trading that identifies squeeze conditions and breakout opportunities based on rolling price windows.
How the Indicator Works
The indicator tracks the highest high and lowest low over your selected lookback period (default: 2 candles) to establish dynamic support and resistance levels. These levels create an "in-range" zone that adapts as new price action develops.
Visual Components
Green Line (Long SL): The rolling window's lowest low - your stop-loss level for long positions
Red Line (Short SL): The rolling window's highest high - your stop-loss level for short positions
Status Indicators:
🟡 Yellow: Squeeze condition (both SLs active)
🟢 Green: Long-only setup
🔴 Red: Short-only setup
⚪ White: Neutral (no active SLs)
The Squeeze Setup Strategy
Step 1: Wait for the Squeeze
The most effective way to use the In-Range Rolling SL is to wait for the in-range stop-loss squeeze to form. During the squeeze, both the green and red lines are active, meaning price has stayed within the rolling window without breaking either boundary. This compression phase indicates that it's "go time" to prepare your trade.
While in the squeeze, analyze the wick high/close relationship against the in-range SL levels. This analysis helps you determine which side is more likely to split when the breakout occurs.
Step 2: Identify the Perfect Breakout
Long Breakout: A perfect breakout candle should close above the in-range stop-loss high (red line) without any wick above it. This clean breakout demonstrates strong momentum and reduces the risk of a false breakout.
Short Breakout: Look for a candle that closes below the in-range SL low (green line), indicating a short-side trade is coming up.
Step 3: Entry Execution
Long Entry: Your entry should be around the region of the breakout. Position your stop-loss just below the top of the breakout candle's high. This placement protects you from failed breakouts while giving the trade room to develop.
Short Entry: Enter as the candle closes below the in-range SL low. The stop-loss for short-side trades is typically 34.26 points of potential loss based on the indicator's measurements.
Risk-Reward Analysis
Entry at Breakout Low
If you enter here at the low of the breakout candle, you're looking at only 8.26 points of drawdown potential. This represents your best-case entry scenario.
Accidental Wrong-Side Entry
However, if you accidentally go long here and your stop gets hit, you'll experience the full in-range stop-loss distance as your loss. This emphasizes the importance of waiting for clear breakout confirmation.
Long Scalp Opportunity
A failed long scalp can be traded here if you missed the market open down-up-down trend. With a stop-loss of 34 points and potential profit greater than 50 points, this setup offers a favorable risk-reward ratio of approximately 1:1.5.
Advanced Trade Management
Failed Breakout Recognition
Follow-Up Candle Validation: If a follow-up candle did not make a higher high than the breakout candle, this could be a trap. Your buy-stop on top of the breakout candle high is not a valid long trade setup in this scenario. Consider adding a "winner" for compensation rather than holding through the potential reversal.
Flip Trade Opportunities
In-range stop-loss tries to flip to the other side often provide excellent entries. If the up candle did not break the previous low, this validates the long continuation and suggests the squeeze is resolving to the upside.
Sustained Position Management
Stop-Loss Guidelines: Stop-loss for long positions should be 26 points of maximum loss. The indicator table displays the delta (Δ) showing your real-time distance to the active stop-loss, helping you manage risk dynamically.
Entry Timing: Your entry should be around the region where the breakout confirms, rather than chasing price after a large move. In order to prepare your trade, position your stop-loss on top of the breakout candle's high for long trades.
Practical Example from the Chart
Looking at the MNQ1! chart, you can see multiple squeeze formations throughout the session. The most notable sequence shows:
An initial downtrend creating a squeeze setup
A perfect breakout candle closing above the red line without upper wick
The subsequent candle validating the move
Later, a failed breakout attempt that created a short opportunity
Multiple flip attempts that provided re-entry points for scalpers
The indicator's table in the top-right continuously updates with the current SL levels, gap size, candle size, and delta values - giving you all the information needed to assess each trade's risk-reward profile in real-time.

BB Breakout-Momentum + Reversion Strategies# BB Breakout-Momentum + Reversion Strategies
## Overview
This indicator combines two complementary Bollinger Band trading strategies that automatically adapt to market conditions. Strategy 1 capitalizes on trending markets with breakout-pullback-momentum setups, while Strategy 2 exploits mean reversion in ranging markets. Advanced filtering using ADX and BB Width ensures each strategy only fires in its optimal market environment.
---
## Strategy 1: Breakout → Pullback → Renewed Momentum (Long B / Short B)
### Best Market Conditions
- **Trending Markets**: ADX ≥ 25
- **High Volatility**: BB Width ≥ 1.0× average
- Directional price action with sustained momentum
### Entry Logic
**Long B (Bullish Breakout):**
1. **Initial Breakout**: Price breaks above upper Bollinger Band with strong momentum
2. **Controlled Pullback**: Price pulls back 1-12 bars but holds above lower band (stays in trend)
3. **Defended Zone**: Pullback creates a support zone based on swing lows (validated by multiple touches)
4. **Renewed Momentum**: Price reclaims with green candle, volume confirmation, bullish MACD
5. **Position Check**: Entry must have cushion below upper band and room to reach targets
**Short B (Bearish Breakdown):**
- Mirror logic for downtrends: breakdown below lower band, pullback stays below upper band, renewed selling pressure
### Risk Management
- **Stop Loss**: Lower of (zone floor/previous low) OR (1.5 × ATR from entry)
- **Targets**:
- T1: Entry + 0.85R (0.85 × 1.5 ATR)
- T2: Entry + 1.40R (1.40 × 1.5 ATR)
- T3: Entry + 2.50R (2.50 × 1.5 ATR)
- T4: Entry + 4.50R (4.50 × 1.5 ATR)
- Risk is calculated using ATR (ATRX = 1.5 ATR), stop uses tighter of structural level (ATRL) or ATRX
---
## Strategy 2: Bollinger Band Mean Reversion (Long R / Short R)
### Best Market Conditions
- **Ranging Markets**: ADX ≤ 20
- **Low Volatility**: BB Width ≤ 0.8× average
- Price oscillating around the mean without sustained trend
### Entry Logic
**Long R (Long Reversion):**
1. **Overextension**: Price breaks below lower Bollinger Band (2 consecutive closes)
2. **Snap Back**: Price crosses back above lower band (re-enters the range)
3. **Entry Window**: Within 2 candles of re-entry, look for:
- **Green candle** (close > open) confirming bullish strength
- Close above previous candle (close > close )
4. **Trigger**: First qualifying candle within 2-bar window executes the trade
**Short R (Short Reversion):**
1. **Overextension**: Price breaks above upper Bollinger Band (2 consecutive closes)
2. **Snap Back**: Price crosses back below upper band (re-enters the range)
3. **Entry Window**: Within 2 candles of re-entry, look for:
- **Red candle** (close < open) confirming bearish pressure
- Close below previous candle (close < close )
4. **Trigger**: First qualifying candle within 2-bar window executes the trade
### Risk Management
- **Stop Loss**: Lower of (previous high/low) OR (1.5 × ATR from entry)
- **Targets**: Same as Strategy 1 (0.85R, 1.4R, 2.5R, 4.5R based on 1.5 ATR)
- Betting on return to Bollinger Band basis (mean)
---
## Advanced Filtering System
### ADX Filter (Average Directional Index)
- **Purpose**: Measures trend strength vs choppy/ranging conditions
- **Trending**: ADX ≥ 25 → Enables Strategy 1 (Breakout)
- **Ranging**: ADX ≤ 20 → Enables Strategy 2 (Reversion)
- **Neutral**: ADX 20-25 → No signals (indecisive market)
### BB Width Filter
- **Purpose**: Confirms volatility expansion/contraction
- **Wide Bands**: Current width ≥ 1.0× 50-bar average → Trending environment
- **Narrow Bands**: Current width ≤ 0.8× 50-bar average → Ranging environment
- **Logic**: Both ADX and BB Width must agree on market state before signaling
### Combined Logic
- **Strategy 1 fires**: When BOTH ADX shows trending AND bands are wide
- **Strategy 2 fires**: When BOTH ADX shows ranging AND bands are narrow
- **Visual Display**: Table at bottom-right shows ADX value, BB Width ratio, and current market state
---
## Visual Elements
### Bollinger Bands
- **Gray line**: 20-period SMA (basis/mean)
- **Green line**: Upper band (basis + 2 standard deviations)
- **Red line**: Lower band (basis - 2 standard deviations)
### Strategy 1 Markers
- **Long B**: Green triangle below bar with "Long B" text
- **Short B**: Orange triangle above bar with "Short B" text
- **Defended Zones**: Green/red boxes showing pullback support/resistance areas
- **Targets**: Green/orange crosses showing T1-T4 and stop loss levels
### Strategy 2 Markers
- **Long R**: Blue label below bar with "Long R" text
- **Short R**: Purple label above bar with "Short R" text
- **Trade Levels**: Horizontal lines extending 50 bars forward
- Blue solid = Entry price
- Red dashed = Stop loss
- Green/Orange dotted = Targets (T1-T4)
### Market State Table
- **ADX**: Current value with color coding (green=trending, orange=ranging, gray=neutral)
- **BB Width**: Ratio vs 50-bar average (e.g., "1.15x" = 15% wider than average)
- **State**: TREND / RANGE / NEUTRAL classification
---
## Settings & Customization
### Bollinger Bands
- **BB Length**: 20 (default) - period for moving average
- **BB Std Dev**: 2.0 (default) - standard deviation multiplier
### ATR & Risk
- **ATR Length**: 14 (default) - period for Average True Range calculation
- All stop losses and targets are derived from 1.5 × ATR
### Trend/Range Filters
- **ADX Length**: 14 (default)
- **ADX Trending Threshold**: 25 (higher = stronger trend required)
- **ADX Ranging Threshold**: 20 (lower = tighter ranging condition)
- **BB Width Average Length**: 50 (period for comparing current width)
- **BB Width Trend Multiplier**: 1.0 (width must be ≥ this × average)
- **BB Width Range Multiplier**: 0.8 (width must be ≤ this × average)
- **Use ADX Filter**: Toggle on/off
- **Use BB Width Filter**: Toggle on/off
### Strategy 1 (Breakout-Momentum)
- **Breakout Lookback**: 15 bars (how far back to search for initial breakout)
- **Min Pullback Bars**: 1 (minimum consolidation period)
- **Max Pullback Bars**: 12 (maximum consolidation period)
- **Show Defended Zone**: Display support/resistance boxes
- **Show Signals**: Display Long B / Short B markers
- **Show Targets**: Display stop loss and target levels
### Strategy 2 (Reversion)
- **Show Signals**: Display Long R / Short R markers
- **Show Trade Levels**: Display entry, stop, and target lines
---
## How to Use This Indicator
### Step 1: Identify Market State
- Check the table in bottom-right corner
- **TREND**: Look for Strategy 1 signals (Long B / Short B)
- **RANGE**: Look for Strategy 2 signals (Long R / Short R)
- **NEUTRAL**: Wait for clearer conditions
### Step 2: Wait for Signal
- Signals only fire when ALL conditions are met (structural + momentum + filters + room-to-target)
- Signals are relatively rare but high-probability
### Step 3: Execute Trade
- **Entry**: Close of signal candle
- **Stop Loss**: Shown as red cross (Strategy 1) or red dashed line (Strategy 2)
- **Targets**: Scale out at T1, T2, T3, T4 or hold for maximum R:R
### Step 4: Management
- Consider moving stop to breakeven after T1
- Trail stop using swing lows/highs in Strategy 1
- Exit full position at T2-T3 in Strategy 2 (mean reversion has limited upside)
---
## Key Principles
### Why This Works
1. **Market Adaptation**: Uses right strategy for right conditions (trend vs range)
2. **Confluence**: Multiple confirmations required (structure + momentum + volatility + room)
3. **Risk-Defined**: Every trade has pre-calculated stop and targets based on ATR
4. **Probability**: Filters reduce noise and increase win rate by waiting for ideal setups
### Common Pitfalls to Avoid
- ❌ Taking signals in NEUTRAL market state (indicators disagree)
- ❌ Overriding the stop loss (it's calculated for a reason)
- ❌ Expecting signals on every swing (quality over quantity)
- ❌ Using Strategy 1 in ranging markets or Strategy 2 in trending markets
- ❌ Ignoring the room-to-target check (signal won't fire if targets are blocked)
### Complementary Analysis
This indicator works best when combined with:
- Higher timeframe trend analysis
- Key support/resistance levels
- Volume analysis
- Market structure (swing highs/lows)
- Risk management rules (position sizing, max daily loss, etc.)
---
## Technical Details
### Indicators Used
- **Bollinger Bands**: 20-period SMA ± 2 standard deviations
- **ATR**: 14-period Average True Range for volatility measurement
- **ADX**: 14-period Average Directional Index for trend strength
- **EMA**: 10 and 20-period exponential moving averages (Strategy 1 filter)
- **MACD**: 12/26/9 settings (Strategy 1 momentum confirmation)
- **Volume**: Compared to 15-bar average (Strategy 1 confirmation)
### Calculation Methodology
- **ATRL** (Structural Risk): Previous swing high/low or defended zone boundary
- **ATRX** (ATR Risk): 1.5 × 14-period ATR from entry price
- **Stop Loss**: Minimum of ATRL and ATRX (tightest protection)
- **Targets**: Always calculated from ATRX (consistent R-multiples)
- **BB Width Ratio**: Current BB width ÷ 50-period SMA of BB width
---
## Performance Notes
### Strengths
- Adapts to changing market conditions automatically
- Clear, objective entry and exit criteria
- Pre-defined risk on every trade
- Filters reduce false signals significantly
- Works across multiple timeframes and instruments
### Limitations
- Signals are infrequent (by design - quality over quantity)
- Requires patience to wait for all conditions to align
- May miss explosive moves if pullback doesn't form properly (Strategy 1)
- Ranging markets can transition to trending (Strategy 2 risk)
- Filters may delay entry in fast-moving markets
### Best Timeframes
- **Strategy 1**: 1H, 4H, Daily (needs time for proper pullback structure)
- **Strategy 2**: 15M, 30M, 1H (mean reversion works best intraday)
- Both strategies can work on any timeframe if market conditions are right
### Best Instruments
- **Liquid markets**: Major stocks, indices, forex pairs, liquid crypto
- **Sufficient volatility**: ATR should be meaningful relative to price
- **Clear trend/range cycles**: Markets that respect technical levels
---
## IMPORTANT DISCLAIMER
### Risk Warning
**TRADING INVOLVES SUBSTANTIAL RISK OF LOSS AND IS NOT SUITABLE FOR ALL INVESTORS.**
This indicator is provided for **educational and informational purposes only**. It does not constitute financial advice, investment advice, trading advice, or any other sort of advice. You should not treat any of the indicator's content as such.
### No Guarantee of Profit
Past performance is not indicative of future results. No trading strategy, including this indicator, can guarantee profits or protect against losses. The market is inherently unpredictable and all trading involves risk.
### User Responsibility
- **Do Your Own Research**: Always conduct your own analysis before making trading decisions
- **Test First**: Backtest and paper trade this strategy before risking real capital
- **Risk Management**: Never risk more than you can afford to lose
- **Position Sizing**: Use appropriate position sizes relative to your account
- **Stop Losses**: Always use stop losses and respect them
- **Market Conditions**: Understand that market conditions change and past behavior may not repeat
### No Liability
The creator of this indicator accepts no liability for any financial losses incurred through the use of this tool. All trading decisions are made at your own risk. You are solely responsible for evaluating the merits and risks associated with the use of any trading systems, signals, or content provided.
### Not Financial Advice
This indicator does not take into account your personal financial situation, investment objectives, risk tolerance, or specific needs. You should consult with a licensed financial advisor before making any investment decisions.
### Technical Limitations
- Indicators can repaint or lag in real-time
- Past signals may look different than real-time signals
- Code bugs or errors may exist despite testing
- TradingView platform limitations may affect functionality
### Market Risks
- Markets can gap, causing stops to be executed at worse prices
- Slippage and commissions can significantly impact results
- High volatility can cause unexpected losses
- Counterparty risk exists in all leveraged products
---
## Version History
- **v1.0**: Initial release combining breakout-momentum and mean reversion strategies
- Includes ADX and BB Width filtering
- ATRL/ATRX risk calculation system
- 2-candle entry window for reversion trades
---
## Credits & License
This indicator combines concepts from classical technical analysis including Bollinger Bands (John Bollinger), ATR (Welles Wilder), and ADX (Welles Wilder). The specific implementation and combination of filters is original work.
**Use at your own risk. Trade responsibly.**
---
*For questions, suggestions, or to report bugs, please comment below or contact the author.*
**Remember: The best indicator is the one between your ears. Use this tool as part of a comprehensive trading plan, not as a standalone solution.**

[TTI] High Volume Close (HVC) Setup📜 ––––HISTORY & CREDITS––––
The High Volume Close (HVC) Setup is a specialised indicator designed for the TradingView platform used to identify specific bar. This tool was developed with the objective of identifying a technical pattern that trades have claimed is significant trading opportunities through a unique blend of volume analysis and price action strategies. It is based on the premise that high-volume bars, when combined with specific price action criteria, can signal key market movements.
The HVC is applicable both for swing and longer term trading and as a technical tool it can be used by traders of any asset type (stocks, ETF, crypto, forex etc).
🦄 –––UNIQUENESS–––
The uniqueness of the HVC Setup lies in its flexibility to determine an important price level based on historically important bar. The idea is to identify significant bars (e.g. those who have created the HIGHEST VOLUME: Ever, Yearly, Quarterly and meet additional criteria from the settings) and plot on the chart the close on that day as a significant level as well as theoretical stop loss and target levels. This approach allows traders to discern high volume bars that are contextually significant — a method not commonly found in standard trading tools.
🎯 ––––WHAT IT DOES––––
The HVC Setup indicator performs a series of calculations to identify high volume close bars/bar (HVC bars) based on the user requirements.
These bars are determined based on the highest volume recorded within a user-inputs:
👉 Period (Ever, Yearly, Quarterly) and must meet additional criteria such as:
👉 a minimum percentage Price Change (change is calculated based on a close/close) and
👉 specific Closing Range requirements for the HVC da.
The theory is that this is a significant bar that is important to know where it is on the chart.
The script includes a comparative analysis of the HVC bar's price against historical price highs (all-time, yearly, quarterly), which provides further context and significance to the identified bars. All of these USER input requirement are then taken into account as a condition to identity the High Volume Close Bar (HVC).
The visual representation includes color-coded bar (default is yellow) and lines to delineate these key trading signals. It then draws a blue line for the place where the close ofthe bar is, a red line that would signify a stop loss and 2 target profit levels equal to 2R and 3R of the risked level (close-stop loss). Additional lines can be turned on/off with their coresponding checkboxes in the settings.
If the user chooses "Ever" for Period - the script will look at the first available bar ever in Tradingview - this is generally the IPO bar;
If the users chooses "Yearly" - the script would look at the highest available bar for a completed year;
If the users chooses "Quarterly" - it would do the same for the quarter. (works on daily timeframe only);
While we have not backtested the performance of the script, this methodology has been widely publicised.
🛠️ ––––HOW TO USE IT––––
To utilize the HVC Setup effectively:
👉Customize Input Settings: Choose the HVC period, percentage change threshold, closing range, stop loss distance, and target multiples according to your trading strategy. Use the tick boxes to enable and disable if a given condition is used within the calculation.
👉Identify HVC Bars: The script highlights HVC bars, indicating potential opportunities based on volume and price action analysis.
👉Interpret Targets and Stop Losses: Use the color-coded lines (green for targets, red for stop losses) to guide your trade entries and exits.
👉Contextual Analysis: Always consider the HVC bar signals in conjunction with overall market trends and additional technical indicators for comprehensive trading decisions.
This script is designed to assist traders in identifying high-potential trading setups by using a combination of volume and price analysis, enhancing traditional methods with a unique, algorithmically driven approach.

MTF HalfTrendIntroduction
A half-trend indicator is a technical analysis tool that uses moving averages and price data to find potential trend reversal and entry points in the form of graphical arrows showing market turning points.
The salient features of this indicator are:
- It uses the phenomenon of moving averages.
- It is a momentum indicator.
- It can indicate a trend change.
- It is capable of detecting a bullish or bearish trend reversal.
- It can signal to sell/buy.
- It is a real-time indicator.
Multi-Timeframe Application
A standout feature is its flexibility across timeframes. Traders have the liberty to choose any timeframe on the chart, enhancing the tool's versatility and making it suitable for both short-term and long-term analyses.
Principle of the Half Trend indicator
This indicator is based on the moving averages. The moving average is the average of the fluctuation or change in the price of an asset. These averages are taken for a time interval.
So, a half-trend indicator takes the moving averages phenomenon as its principle for working. The most commonly used moving averages in a half trend indicator are:
- Relative strength index (RSI)
- EMA (estimated moving average)
Components of a Half Trend indicator
There are two main components of a half trend indicator:
- Half trend line
- Arrows
- ATR lines
Half trend line
Half trend line represents this indicator on a candlestick chart. This line shows the trend of a chart in real-time. A half-trend line is based on the moving averages.
There are two further components of a half-trend line:
- Redline
- Blue line
A red line represents a bearish trend. When the half-trend line turns red, a trend is facing a dip. It is time for the bears to take control of the market. A bearish control of the market represents the domination of sellers in the market.
On the other hand, the blue line represents the bullish nature of the market. It tells a trader that the bullish sentiment of the market is prevailing. A bullish market means the number of buyers is significantly greater than the number of sellers.
Moreover, a trader can change these colors to his choice by customization.
Arrows
There are two types of arrows in this indicator which help a trader with the entry and exit points. These arrows are,
- Blue arrow
- Red arrow
A blue arrow signals a buying trade; on the other hand, a red arrow tells a trader about the selling of the assets. These arrows work with the moving average line to formulate a trading strategy.
The color of these arrows is changed if a trader desires so.
ATR lines
The ATR blue and red lines represent the Average True Range of the Half trend line. They may be used as stop loss or take profit levels.
Pros and Cons
Pros
- It is a very easy to eyes indicator.
- This is a very useful friendly indicator.
- It provides sufficient information to beginner traders.
- It provides sufficient information for entry points in a trade.
- A half-trend indicator provides a good exit strategy for a trader.
- It provides information about market reversals.
- It helps a trader to find a bullish and bearish sentiment in the market.
Cons
- It is a real-time indicator. So, it can lag.
- The lagging of this indicator can lead to miss opportunities.
- The most advanced and professional traders may not rely on this indicator for crucial trading decisions.
- The lagging of this indicator can predict false reversals of the market.
- It can create false signals.
- It requires the confluence of the other technical tools for a better success ratio.
Settings for Half Trend indicator
The default settings for half trend indicator are:
Amplitude = 2
Channel deviation = 2
Different markets or financial instruments may require different settings for optimal execution.
Amplitude: The degree that the Half trend line takes the internal variables into consideration. The higher the number, the fewer trades. The default value is 2.
Channel deviation: The ATR value calculation from the Half trend line. The default value is 2.
Trading strategy
It is an effective indicator in terms of strategy formation for a trading setup. The new and beginner trades can take benefit from this indicator for the formulation of a good trading setup. This indicator also helps seasoned and professional traders formulate a good trading setup with other technical tools.
The trading strategy involving a half-trend indicator is divided into three parts:
- Entry and exit
- Risk management
- Take profit
Entry and exit
It is an effective indicator that provides sufficient information about the entry and exit points in a trading setup. The profit of a trader is directly proportional to the appropriate entry and exit points. So, it is a crucial step in any trading setup.
The blue and red arrows provide information about the entry and exit points in a trading setup. Furthermore, the entry and exit for the bullish and bearish setups are as follows.
Entry and exit for a bullish setup
If a blue arrow appears under the half-trend line, it means the bullish sentiment of the market is getting stronger in the future. So, it is a signal for entry in a bullish setup.
As the red arrow appears on the chart, it is a signal to exit your trade. The red arrow represents a reversal in the market, so it is a good opportunity to close your trade in a bullish setup.
Entry and exit for a bearish setup
Suppose a red arrow appears above the red moving average line. It is a good opportunity to enter a trade in a bearish setup. The red line represents that sooner the sellers are going to take control and the value of the asset is about to face a dip. So it is the best time to make your move.
As the opposite arrow appears in the chart, it is time to exit from a bearish trade setup.
Re-entering a position
Bullish setup
- The half-trend line is blue.
- At least one candle closes below the blue half-trend line.
- Enter on the candle that closes above the blue half-trend line.
Bearish setup
- The half-trend line is red.
- At least one candle closes above the red half-trend line.
- Enter on the candle that closes below the red half-trend line.
Risk management
Risk management is an integral part of a trading setup. It is an important step to protect your potential profits and losses.
When trading in a bullish market, place the stop loss at the prior swing low. It will help you to cut your losses in case the prices move to the lower end.
In the case of a bearish market, place your stop loss above the prior swing high.
A trader may trail the stop loss using the ATR lines.
The new trader often makes mistakes in the placement of the stop loss. If you don’t place the stop loss at an appropriate point. It can drain your bank account and ruin your trading experience. Is is recommended not to risk more than 2% of your trading account, per trade.
Take profit
The blue ATR line may be used as one take profit level on a bullish setup followed by the previous swing high. The signal reversal would indicate the final take profit and closing of any position.
The red ATR line may be used as one take profit level on a bearish setup followed by the previous swing low. The signal reversal would indicate the final take profit and closing of any position.
Conclusion
A half trend indicator is a decent indicator that can transform your trading experience. It is a dual indicator that is based on the moving averages as well as helps you to form a trading strategy. If you are a new trader, this indicator can help you to learn and flourish in the trading universe. If you are a seasoned trader, I recommend you use this indicator with other technical analysis tools to enhance your success ratio.
All credits go to:
- @everget the original creator of this indicator (I just added the MTF capability).
- Ali Muhammad original author of much of the description used.

Supertrend, MA 44|6, EMA FIBS 13|21|34I have this indicator based on my strategy. This indicator is based on existing functions available in the system. I haven't added anything new. This indicator uses Supertrend, MA44|6, EMA fibs 13|21|34 combining to find a profitable trade.
- Supertrend : Indicator uses supertrend strategy with default ATR period of 10 and Factor value 3. These values can be customized based on your preferences. Uptrend is denoted by green color and downtrend by red color. You can change the colors based on your preferences.
- MA 44|6: Indicator plots moving averages of 44 and 6. These values can be customized based on your preferences. Although it is highly recommended to keep 44 as is. Value 6 can be adjusted based on your preference. Default color for uptrend is green and for downtrend is red. You can change the colors based on your preferences.
- FIBS EMA 13|21|34: Indicator plots EMA of fibbonacci numbers 13, 21,34 to identify consolidation and breakout. The periods can be adjusted but it is highly recommended not to do so. Default colors for 13,21 and 34 is Aqua, Blue and Navy respectively. You can change the colors based on your preferences.
When to take trade?
To take a trade all conditions needs to be fulfilled.
Supertrend : Always take a trade in the direction of Supertrend. It is always advisable to take trade if the trend is changing or price is taking support of resistance.
MA 44|6: Moving average 44 indicates average price of 44 last candles and 6 for last 6 candles. Price crossing MA 44 indicates change in trend. It is advisable to take trade at crossing the line above or below. If many candles closing near MA 44 then it indicates consolidation. The more far the candle closes from MA44 the better. MA 6 is used to identify when to enter or exit the trade. If candle closes away from MA 6 then you can wait for candle to start near the MA 6 line. If candle closes above/below MA 6 you can exit your trade.
Fibonacci 13|21|34: When all lines are closed it indicates consolidation. When price breakouts to either direction you can take a trade in that direction with following conditions.
Bullish Trade:
When to enter?
If candle closed above MA 44, Supertrend is uptrend and EMA Fibs are moving away and are above MA 44. The price is near to MA 6 line then you can enter into bullish trade. If price is away from MA 6 then you should wait until the price/line comes near to avoid loss.
When to exit?
Price moving in opposite direction:
You should set a stop loss when you enter the trade. The stop loss can be set below the low of the previous candle or any other strategy you have. But it is really important to set the stop loss. If price moves in opposite direction then your stop loss will hit and you will be out of the trade.
Price moving in same direction:
Once you enter the trade you can exit based on two conditions whichever suits you.
1. Exit the trade if candle closes below MA6. The drawback is you may exit too early. You can also adjust the period based on your preferences.
2. Exit the trade if candle closed below low of previous candle. The drawback is you may book less profit but you can capture the movement very well.
Bearish Trade:
When to enter?
If candle closed below MA 44, Supertrend is downtrend and EMA Fibs are moving away and are below MA 44. The price is near to MA 6 line then you can enter into bearish trade. If price is away from MA 6 then you should wait until the price/line comes near to avoid loss.
When to exit?
Price moving in opposite direction:
You should set a stop loss when you enter the trade. The stop loss can be set below the low of the previous candle or any other strategy you have. But it is really important to set the stop loss. If price moves in opposite direction then your stop loss will hit and you will be out of the trade.
Price moving in same direction:
Once you enter the trade you can exit based on two conditions whichever suits you.
1. Exit the trade if candle closes below MA6. The drawback is you may exit too early. You can also adjust the period based on your preferences.
2. Exit the trade if candle closed below low of previous candle. The drawback is you may book less profit but you can capture the movement very well.
When not to take trade?
1. If MA 44 is completely horizontal and EMA Fibs are very close to each other. This indicates that the market is consolidated and if you enter the trade you may hit stop loss very often.
Note: Please note that I am not expert and I don't take any responsibility of your profits or losses. I have created this indicator based on my knowledge and it is for study purpose. Use of this indicator is totally your responsibility. Use all your knowledge and expertise and don't totally depend on the indicator. Don't forget to use stop loss and do money management.
Happy Trading!

Supply & Demand ZonesThis indicator detects high-probability supply and demand zones using a multi-step smart money concept approach:
Liquidity Sweep Detection: Identifies when price sweeps above a pivot high (supply setup) or below a pivot low (demand setup), capturing liquidity grabs by institutional traders.
Displacement Confirmation: Requires a strong displacement candle (measured by ATR and body percentage) or fair value gap (FVG/imbalance) in the opposite direction after the sweep.
Volume Confirmation: Optional filter ensures zones form only when volume exceeds the user-defined threshold, indicating institutional participation.
Smart Filtering: Built-in logic prevents overlapping zones, enforces minimum spacing between signals, and requires confirmation bars to eliminate false signals.
Zone Lifecycle Management: Zones are automatically removed when price closes through them with momentum. Breached zones can optionally "flip" to the opposite type when re-tested with strong displacement.
✨ Key Features
Clean Visual Display: Small "D" (Demand) and "S" (Supply) labels with shaded zone boxes
Non-Repainting: All signals use confirmed historical data—no lookahead or repainting
Volume Filter: Optional confirmation using volume spike detection
Zone Flip Logic: Breached demand zones can become supply (and vice versa) when violated
Overlap Prevention: Smart algorithm prevents clustered or duplicate zones
Confirmation Delay: Configurable wait period after sweep to confirm genuine setups
Customizable Inputs: Adjust pivot sensitivity, displacement thresholds, volume filters, and more
Alert Ready: Built-in alert conditions for new supply and demand zone formations
🎯 How to Add to Your Chart
Favorite the Indicator: Click the star icon to add this script to your favorites
Open Your Chart: Navigate to the asset and timeframe you want to trade (works best on 5m-1H intraday charts)
Add Indicator: Click "Indicators" at the top, search for "Supply & Demand Zones (Smart Filtered)", and add to chart
Customize Settings: Click the gear icon ⚙️ to adjust inputs based on your trading style and instrument volatility
Set Alerts: Right-click the indicator name → "Add alert" → Select "Supply Zone" or "Demand Zone" conditions
📖 How to Use
Demand Zones (Green "D" Labels):
Price swept below a swing low (liquidity grab)
Strong bullish displacement or imbalance followed
Trading Action: Look for LONG entries when price returns to the zone or on immediate continuation
Stop Loss: Place just below the zone or sweep low
Target: Next resistance level, supply zone, or risk-reward ratio target
Supply Zones (Red "S" Labels):
Price swept above a swing high (liquidity grab)
Strong bearish displacement or imbalance followed
Trading Action: Look for SHORT entries when price returns to the zone or on immediate continuation
Stop Loss: Place just above the zone or sweep high
Target: Next support level, demand zone, or risk-reward ratio target
Flipped Zones (Orange Labels):
Previous demand/supply zone was broken with strong momentum
Zone has flipped polarity and may now act as the opposite type
Trading Action: Exercise caution—wait for additional confirmation before trading flipped zones
🔍 What to Look For
High-Quality Setups:
Zone forms with above-average volume (check volume filter is enabled)
Clear liquidity sweep visible on the chart
Strong displacement candle with large body percentage
Zone aligns with overall market trend or key structure levels
Multiple timeframe confirmation (check higher timeframe for context)
Avoid These Setups:
Zones forming in choppy, low-volume conditions
Multiple overlapping zones in the same area (indicator filters these automatically)
Zones that appear immediately after news events (set confirmation bars higher)
Counter-trend zones without additional confluence
⚙️ Recommended Settings by Timeframe
5-Minute Charts (Scalping):
Pivot Lookback: 3/3
Min Displacement ATR: 0.9
Confirmation Bars: 1
Min Zone Spacing: 3-5 bars
Volume Threshold: 1.2x
15-Minute Charts (Intraday):
Pivot Lookback: 4/4 (default)
Min Displacement ATR: 1.0 (default)
Confirmation Bars: 2 (default)
Min Zone Spacing: 5-8 bars
Volume Threshold: 1.2x
1-Hour Charts (Swing Trading):
Pivot Lookback: 5/5
Min Displacement ATR: 1.2-1.5
Confirmation Bars: 3
Min Zone Spacing: 8-12 bars
Volume Threshold: 1.3x
💡 Trading Tips & Best Practices
Combine with Price Action: Use this indicator alongside candlestick patterns, support/resistance, and trendlines for confirmation
Multiple Timeframe Analysis: Check higher timeframes for overall bias and major zones
Volume is Key: Enable volume filter to focus on institutional-backed moves
Risk Management: Always use stop losses and proper position sizing
Backtesting: Test settings on your preferred instruments and timeframes before live trading
Context Matters: Consider market conditions, news events, and session times
Wait for Confirmation: Don't rush entries—wait for price reaction at the zone
⚠️ Important Disclaimers
Educational Purpose Only: This indicator is provided for educational and informational purposes. It does not constitute financial advice, investment recommendations, or trading signals.
No Guarantees: Past performance and backtested results do not guarantee future results. Trading involves substantial risk of loss.

Enigma Sniper 369The "Enigma Sniper 369" is a custom-built Pine Script indicator designed for TradingView, tailored specifically for forex traders seeking high-probability entries during high-volatility market sessions.
Unlike generic trend-following or scalping tools, this indicator uniquely combines session-based "kill zones" (London and US sessions), momentum-based candle analysis, and an optional EMA trend filter to pinpoint liquidity grabs and reversal opportunities.
Its originality lies in its focus on liquidity hunting—identifying levels where stop losses are likely clustered (around swing highs/lows and wick midpoints)—and providing visual entry zones that are dynamically removed once price breaches them, reducing clutter and focusing on actionable signals.
The name "369" reflects the structured approach of three key components (session timing, candle logic, and trend filter) working in harmony to snipe precise entries.
What It Does
"Enigma Sniper 369" identifies potential buy and sell opportunities by drawing two types of horizontal lines on the chart during user-defined London and US
session kill zones:
Solid Lines: Mark the swing low (for buys) or swing high (for sells) of a trigger candle, indicating a potential entry point where stop losses might be clustered.
Dotted Lines: Mark the 50% level of the candle’s wick (lower wick for buys, upper wick for sells), serving as a secondary confirmation zone for entries or tighter stop-loss placement.
These lines are plotted only when specific candle conditions are met within the kill zones, and they are automatically deleted once the price crosses them, signaling that the liquidity at that level has likely been grabbed. The indicator also includes an optional EMA filter to ensure trades align with the broader trend, reducing false signals in choppy markets.
How It Works
The indicator’s logic is built on a multi-layered approach:
Kill Zone Timing: Trades are only considered during user-defined London and US session hours (e.g., London from 02:00 to 12:00 UTC, as seen in the screenshots). These sessions are known for high volatility and liquidity, making them ideal for capturing institutional moves.
Candle-Based Momentum Logic:
Buy Signal: A candle must close above its midpoint (indicating bullish momentum) and have a lower low than the previous candle (suggesting a potential liquidity grab below the previous swing low). This is expressed as close > (high + low) / 2 and low < low .
Sell Signal: A candle must close below its midpoint (bearish momentum) and have a higher high than the previous candle (indicating a potential liquidity grab above the previous swing high), expressed as close < (high + low) / 2 and high > high .
These conditions ensure the indicator targets candles that break recent structure to hunt stop losses while showing directional momentum.
Optional EMA Filter: A 50-period EMA (customizable) can be enabled to filter signals based on trend direction.
Buy signals are only generated if the EMA is trending upward (ema_value > ema_value ), and sell signals require a downward EMA trend (ema_value < ema_value ). This reduces noise by aligning entries with the broader market trend.
Liquidity Levels and Deletion Logic:
For a buy signal, a solid green line is drawn at the candle’s low, and a dotted green line at the 50% level of the lower wick (from the candle body’s bottom to the low).
For a sell signal, a solid red line is drawn at the candle’s high, and a dotted red line at the 50% level of the upper wick (from the body’s top to the high).
These lines extend to the right until the price crosses them, at which point they are deleted, indicating the liquidity at that level has been taken (e.g., stop losses triggered).
Alerts: The indicator includes alert conditions for buy and sell signals, notifying traders when a new setup is identified.
Underlying Concepts
The indicator is grounded in the concept of liquidity hunting, a strategy often employed by institutional traders. Markets frequently move to levels where stop losses are clustered—typically just beyond swing highs or lows—before reversing in the opposite direction. The "Enigma Sniper 369" targets these moves by identifying candles that break structure (e.g., a lower low or higher high) during high-volatility sessions, suggesting a potential sweep of stop losses. The 50% wick level acts as a secondary confirmation, as this midpoint often represents a zone where tighter stop losses are placed by retail traders. The optional EMA filter adds a trend-following element, ensuring entries are taken in the direction of the broader market momentum, which is particularly useful on lower timeframes like the 15-minute chart shown in the screenshots.
How to Use It
Here’s a step-by-step guide based on the provided usage example on the GBP/USD 15-minute chart:
Setup the Indicator: Add "Enigma Sniper 369" to your TradingView chart. Adjust the London and US session hours to match your timezone (e.g., London from 02:00 to 12:00 UTC, US from 13:00 to 22:00 UTC). Customize the EMA period (default 50) and line styles/colors if desired.
Identify Kill Zones: The indicator highlights the London session in light green and the US session in light purple, as seen in the screenshots. Focus on these periods for signals, as they are the most volatile and likely to produce liquidity grabs.
Wait for a Signal: Look for solid and dotted lines to appear during the kill zones:
Buy Setup: A solid green line at the swing low and a dotted green line at the 50% lower wick level indicate a potential buy. This suggests the market may have grabbed liquidity below the swing low and is now poised to move higher.
Sell Setup: A solid red line at the swing high and a dotted red line at the 50% upper wick level indicate a potential sell, suggesting liquidity was taken above the swing high.
Place Your Trade:
For a buy, set a buy limit order at the dotted green line (50% wick level), as this is a more conservative entry point. Place your stop loss just below the solid green line (swing low) to cover the full swing. For example, in the screenshots, the market retraces to the dotted line at 1.32980 after a liquidity grab below the swing low, triggering a buy limit order.
For a sell, set a sell limit order at the dotted red line, with a stop loss just above the solid red line.
Monitor Price Action: Once the price crosses a line, it is deleted, indicating the liquidity at that level has been taken. In the screenshots, after the buy limit is triggered, the market moves higher, confirming the setup. The caption notes, “The market returns and tags us in long with a buy limit,” highlighting this retracement strategy.
Additional Context: Use the indicator to identify liquidity levels that may be targeted later. For example, the screenshot notes, “If a new session is about to open I will wait for the grab liquidity to go long,” showing how the indicator can be used to anticipate future moves at session opens (e.g., London open at 1.32980).
Risk Management: Always set a stop loss below the swing low (for buys) or above the swing high (for sells) to protect against adverse moves. The 50% wick level helps tighten entries, improving the risk-reward ratio.
Practical Example
On the GBP/USD 15-minute chart, during the London session (02:00 UTC), the indicator identifies a buy setup with a solid green line at 1.32901 (swing low) and a dotted green line at 1.32980 (50% wick level). The market initially dips below the swing low, grabbing liquidity, then retraces to the dotted line, triggering a buy limit order. The price subsequently rises to 1.33404, yielding a profitable trade. The user notes, “The logic is in the last candle it provides new level to go long,” emphasizing the indicator’s ability to identify fresh levels after a liquidity sweep.
Customization Tips
Adjust the EMA period to suit your timeframe (e.g., a shorter period like 20 for faster signals on lower timeframes).
Modify the session hours to align with your broker’s timezone or specific market conditions.
Use the alert feature to get notified of new setups without constantly monitoring the chart.
Why It’s Useful for Traders
The "Enigma Sniper 369" stands out by combining session timing, momentum-based candle analysis, and liquidity hunting into a single tool. It provides clear, actionable levels for entries and stop losses, removes invalid signals dynamically, and aligns trades with high-probability market conditions. Whether you’re a scalper looking for quick moves during London open or a swing trader targeting session-based reversals, this indicator offers a structured, data-driven approach to trading.

Mile Runner - Swing Trade LONGMile Runner - Swing Trade LONG Indicator - By @jerolourenco
Overview
The Mile Runner - Swing Trade LONG indicator is designed for swing traders who focus on LONG positions in stocks, BDRs (Brazilian Depositary Receipts), and ETFs. It provides clear entry signals, stop loss, and take profit levels, helping traders identify optimal buying opportunities with a robust set of technical filters. The indicator is optimized for daily candlestick charts and combines multiple technical analysis tools to ensure high-probability trades.
Key Features
Entry Signals: Visualized as green triangles below the price bars, indicating a potential LONG entry.
Stop Loss and Take Profit Levels: Automatically plotted on the chart for easy reference.
Stop Loss: Based on the most recent pivot low (support level).
Take Profit: Calculated using a Fibonacci-based projection from the entry price to the stop loss.
Trend and Momentum Filters: Ensures trades align with the prevailing trend and have sufficient momentum.
Volume and Volatility Confirmation: Verifies market interest and price movement potential.
How It Works
The indicator uses a combination of technical tools to filter and confirm trade setups:
Exponential Moving Averages (EMAs):
A short EMA (default: 9 periods) and a long EMA (default: 21 periods) identify the trend.
A bullish crossover (EMA9 crosses above EMA21) signals a potential upward trend.
Money Flow Index (MFI):
Confirms buying pressure when MFI > 50.
Average True Range (ATR):
Ensures sufficient volatility by checking if ATR exceeds its 20-period moving average.
Volume:
Confirms market interest when volume exceeds its 20-period moving average.
Pivot Lows:
Identifies recent support levels (pivot lows) to set the stop loss.
Ensures the pivot low is recent (within the last 10 bars by default).
Additional Trend Filter:
Confirms the long EMA is rising, reinforcing the bullish trend.
Inputs and Customization
The indicator is highly customizable, allowing traders to tailor it to their strategies:
EMA Periods: Adjust the short and long EMA lengths.
ATR and MFI Periods: Modify lookback periods for volatility and momentum.
Pivot Lookback: Control the sensitivity of pivot low detection.
Fibonacci Level: Adjust the Fibonacci retracement level for take profit.
Take Profit Multiplier: Fine-tune the aggressiveness of the take profit target.
Max Pivot Age: Set the maximum bars since the last pivot low for relevance.
Usage Instructions
Apply the Indicator:
Add the "Mile Runner - Swing Trade LONG" indicator to your TradingView chart.
Best used on daily charts for swing trading.
Look for Entry Signals:
A green triangle below the price bar signals a potential LONG entry.
Set Stop Loss and Take Profit:
Stop Loss: Red dashed line indicating the stop loss level.
Take Profit: Purple dashed line showing the take profit level.
Monitor the Trade:
The entry price is marked with a green dashed line for reference.
Adjust trade management based on the plotted levels.
Set Alerts:
Use the built-in alert condition to get notified of new LONG entry signals.
Important Notes
For LONG Positions Only : Designed exclusively for swing trading LONG positions.
Timeframe: Optimized for daily charts but can be tested on other timeframes.
Asset Types: Works best with stocks, BDRs, and ETFs.
Risk Management: Always align stop loss and take profit levels with your risk tolerance.
Why Use Mile Runner?
The Mile Runner indicator simplifies swing trading by integrating trend, momentum, volume, and volatility filters into one user-friendly tool. It helps traders:
Identify high-probability entry points.
Establish clear stop loss and take profit levels.
Avoid low-volatility or low-volume markets.
Focus on assets with strong buying pressure and recent support.
By following its signals and levels, traders can make informed decisions and enhance their swing trading performance. Customize the inputs and test it on your favorite assets—happy trading!

Mars Signals - Ultimate Institutional Suite v3.0(Joker)Comprehensive Trading Manual
Mars Signals – Ultimate Institutional Suite v3.0 (Joker)
## Chapter 1 – Philosophy & System Architecture
This script is not a simple “buy/sell” indicator.
Mars Signals – UIS v3.0 (Joker) is designed as an institutional-style analytical assistant that layers several methodologies into a single, coherent framework.
The system is built on four core pillars:
1. Smart Money Concepts (SMC)
- Detection of Order Blocks (professional demand/supply zones).
- Detection of Fair Value Gaps (FVGs) (price imbalances).
2. Smart DCA Strategy
- Combination of RSI and Bollinger Bands
- Identifies statistically discounted zones for scaling into spot positions or exiting shorts.
3. Volume Profile (Visible Range Simulation)
- Distribution of volume by price, not by time.
- Identification of POC (Point of Control) and high-/low-volume areas.
4. Wyckoff Helper – Spring
- Detection of bear traps, liquidity grabs, and sharp bullish reversals.
All four pillars feed into a Confluence Engine (Scoring System).
The final output is presented in the Dashboard, with a clear, human-readable signal:
- STRONG LONG 🚀
- WEAK LONG ↗
- NEUTRAL / WAIT
- WEAK SHORT ↘
- STRONG SHORT 🩸
This allows the trader to see *how many* and *which* layers of the system support a bullish or bearish bias at any given time.
## Chapter 2 – Settings Overview
### 2.1 General & Dashboard Group
- Show Dashboard Panel (`show_dash`)
Turns the dashboard table in the corner of the chart ON/OFF.
- Show Signal Recommendation (`show_rec`)
- If enabled, the textual signal (STRONG LONG, WEAK SHORT, etc.) is displayed.
- If disabled, you only see feature status (ON/OFF) and the current price.
- Dashboard Position (`dash_pos`)
Determines where the dashboard appears on the chart:
- `Top Right`
- `Bottom Right`
- `Top Left`
### 2.2 Smart Money (SMC) Group
- Enable SMC Strategy (`show_smc`)
Globally enables or disables the Order Block and FVG logic.
- Order Block Pivot Lookback (`ob_period`)
Main parameter for detecting key pivot highs/lows (swing points).
- Default value: 5
- Concept:
A bar is considered a pivot low if its low is lower than the lows of the previous 5 and the next 5 bars.
Similarly, a pivot high has a high higher than the previous 5 and the next 5 bars.
These pivots are used as anchors for Order Blocks.
- Increasing `ob_period`:
- Fewer levels.
- But levels tend to be more significant and reliable.
- In highly volatile markets (major news, war events, FOMC, etc.),
using values 7–10 is recommended to filter out weak levels.
- Show Fair Value Gaps (`show_fvg`)
Enables/disables the drawing of FVG zones (imbalances).
- Bullish OB Color (`c_ob_bull`)
- Color of Bullish Order Blocks (Demand Zones).
- Default: semi-transparent green (transparency ≈ 80).
- Bearish OB Color (`c_ob_bear`)
- Color of Bearish Order Blocks (Supply Zones).
- Default: semi-transparent red.
- Bullish FVG Color (`c_fvg_bull`)
- Color of Bullish FVG (upward imbalance), typically yellow.
- Bearish FVG Color (`c_fvg_bear`)
- Color of Bearish FVG (downward imbalance), typically purple.
### 2.3 Smart DCA Strategy Group
- Enable DCA Zones (`show_dca`)
Enables the Smart DCA logic and visual labels.
- RSI Length (`rsi_len`)
Lookback period for RSI (default: 14).
- Shorter → more sensitive, more noise.
- Longer → fewer signals, higher reliability.
- Bollinger Bands Length (`bb_len`)
Moving average period for Bollinger Bands (default: 20).
- BB Multiplier (`bb_mult`)
Standard deviation multiplier for Bollinger Bands (default: 2.0).
- For extremely volatile markets, values like 2.5–3.0 can be used so that only extreme deviations trigger a DCA signal.
### 2.4 Volume Profile (Visible Range Sim) Group
- Show Volume Profile (`show_vp`)
Enables the simulated Volume Profile bars on the right side of the chart.
- Volume Lookback Bars (`vp_lookback`)
Number of bars used to compute the Volume Profile (default: 150).
- Higher values → broader historical context, heavier computation.
- Row Count (`vp_rows`)
Number of vertical price segments (rows) to divide the total price range into (default: 30).
- Width (%) (`vp_width`)
Relative width of each volume bar as a percentage.
In the code, bar widths are scaled relative to the row with the maximum volume.
> Technical note: Volume Profile calculations are executed only on the last bar (`barstate.islast`) to keep the script performant even on higher timeframes.
### 2.5 Wyckoff Helper Group
- Show Wyckoff Events (`show_wyc`)
Enables detection and plotting of Wyckoff Spring events.
- Volume MA Length (`vol_ma_len`)
Length of the moving average on volume.
A bar is considered to have Ultra Volume if its volume is more than 2× the volume MA.
## Chapter 3 – Smart Money Strategy (Order Blocks & FVG)
### 3.1 What Is an Order Block?
An Order Block (OB) represents the footprint of large institutional orders:
- Bullish Order Block (Demand Zone)
The last selling region (bearish candle/cluster) before a strong upward move.
- Bearish Order Block (Supply Zone)
The last buying region (bullish candle/cluster) before a strong downward move.
Institutions and large players place heavy orders in these regions. Typical price behavior:
- Price moves away from the zone.
- Later returns to the same zone to fill unfilled orders.
- Then continues the larger trend.
In the script:
- If `pl` (pivot low) forms → a Bullish OB is created.
- If `ph` (pivot high) forms → a Bearish OB is created.
The box is drawn:
- From `bar_index ` to `bar_index`.
- Between `low ` and `high `.
- `extend=extend.right` extends the OB into the future, so it acts as a dynamic support/resistance zone.
- Only the last 4 OB boxes are kept to avoid clutter.
### 3.2 Order Block Color Guide
- Semi-transparent Green (`c_ob_bull`)
- Represents a Bullish Order Block (Demand Zone).
- Interpretation: a price region with a high probability of bullish reaction.
- Semi-transparent Red (`c_ob_bear`)
- Represents a Bearish Order Block (Supply Zone).
- Interpretation: a price region with a high probability of bearish reaction.
Overlap (Multiple OBs in the Same Area)
When two or more Order Blocks overlap:
- The shared area appears visually denser/stronger.
- This suggests higher order density.
- Such zones can be treated as high-priority levels for entries, exits, and stop-loss placement.
### 3.3 Demand/Supply Logic in the Scoring Engine
is_in_demand = low <= ta.lowest(low, 20)
is_in_supply = high >= ta.highest(high, 20)
- If current price is near the lowest lows of the last 20 bars, it is considered in a Demand Zone → positive impact on score.
- If current price is near the highest highs of the last 20 bars, it is considered in a Supply Zone → negative impact on score.
This logic complements Order Blocks and helps the Dashboard distinguish whether:
- Market is currently in a statistically cheap (long-friendly) area, or
- In a statistically expensive (short-friendly) area.
### 3.4 Fair Value Gaps (FVG)
#### Concept
When the market moves aggressively:
- Some price levels are skipped and never traded.
- A gap between wicks/shadows of consecutive candles appears.
- These regions are called Fair Value Gaps (FVGs) or Imbalances.
The market generally “dislikes” imbalance and often:
- Returns to these zones in the future.
- Fills the gap (rebalance).
- Then resumes its dominant direction.
#### Implementation in the Code
Bullish FVG (Yellow)
fvg_bull_cond = show_smc and show_fvg and low > high and close > high
if fvg_bull_cond
box.new(bar_index , high , bar_index, low, ...)
Core condition:
`low > high ` → the current low is above the high of two bars ago; the space between them is an untraded gap.
Bearish FVG (Purple)
fvg_bear_cond = show_smc and show_fvg and high < low and close < low
if fvg_bear_cond
box.new(bar_index , low , bar_index, high, ...)
Core condition:
`high < low ` → the current high is below the low of two bars ago; again a price gap exists.
#### FVG Color Guide
- Transparent Yellow (`c_fvg_bull`) – Bullish FVG
Often acts like a magnet for price:
- Price tends to retrace into this zone,
- Fill the imbalance,
- And then continue higher.
- Transparent Purple (`c_fvg_bear`) – Bearish FVG
Price tends to:
- Retrace upward into the purple area,
- Fill the imbalance,
- And then resume downward movement.
#### Trading with FVGs
- FVGs are *not* standalone entry signals.
They are best used as:
- Targets (take-profit zones), or
- Reaction areas where you expect a pause or reversal.
Examples:
- If you are long, a bearish FVG above is often an excellent take-profit zone.
- If you are short, a bullish FVG below is often a good cover/exit zone.
### 3.5 Core SMC Trading Templates
#### Reversal Long
1. Price trades down into a green Order Block (Demand Zone).
2. A bullish confirmation candle (Close > Open) forms inside or just above the OB.
3. If this zone is close to or aligned with a bullish FVG (yellow), the signal is reinforced.
4. Entry:
- At the close of the confirmation candle, or
- Using a limit order near the upper boundary of the OB.
5. Stop-loss:
- Slightly below the OB.
- If the OB is broken decisively and price consolidates below it, the zone loses validity.
6. Targets:
- The next FVG,
- Or the next red Order Block (Supply Zone) above.
#### Reversal Short
The mirror scenario:
- Price rallies into a red Order Block (Supply).
- A bearish confirmation candle forms (Close < Open).
- FVG/premium structure above can act as a confluence.
- Stop-loss goes above the OB.
- Targets: lower FVGs or subsequent green OBs below.
## Chapter 4 – Smart DCA Strategy (RSI + Bollinger Bands)
### 4.1 Smart DCA Concept
- Classic DCA = buying at fixed time intervals regardless of price.
- Smart DCA = scaling in only when:
- Price is statistically cheaper than usual, and
- The market is in a clear oversold condition.
Code logic:
rsi_val = ta.rsi(close, rsi_len)
= ta.bb(close, bb_len, bb_mult)
dca_buy = show_dca and rsi_val < 30 and close < bb_lower
dca_sell = show_dca and rsi_val > 70 and close > bb_upper
Conditions:
- DCA Buy – Smart Scale-In Zone
- RSI < 30 → oversold.
- Close < lower Bollinger Band → price has broken below its typical volatility envelope.
- DCA Sell – Overbought/Distribution Zone
- RSI > 70 → overbought.
- Close > upper Bollinger Band → price is extended far above the mean.
### 4.2 Visual Representation on the Chart
- Green “DCA” Label Below Candle
- Shape: `labelup`.
- Color: lime background, white text.
- Meaning: statistically attractive level for laddered spot entries or short exits.
- Red “SELL” Label Above Candle
- Warning that the market is in an extended, overbought condition.
- Suitable for profit-taking on longs or considering short entries (with proper confluence and risk management).
- Light Green Background (`bgcolor`)
- When `dca_buy` is true, the candle background turns very light green (high transparency).
- This helps visually identify DCA Zones across the chart at a glance.
### 4.3 Practical Use in Trading
#### Spot Trading
Used to build a better average entry price:
- Every time a DCA label appears, allocate a fixed portion of capital (e.g., 2–5%).
- Combining DCA signals with:
- Green OBs (Demand Zones), and/or
- The Volume Profile POC
makes the zone structurally more important.
#### Futures Trading
- Longs
- Use DCA Buy signals as low-risk zones for opening or adding to longs when:
- Price is inside a green OB, or
- The Dashboard already leans LONG.
- Shorts
- Use DCA Sell signals as:
- Exit zones for longs, or
- Areas to initiate shorts with stops above structural highs.
## Chapter 5 – Volume Profile (Visible Range Simulation)
### 5.1 Concept
Traditional volume (histogram under the chart) shows volume over time.
Volume Profile shows volume by price level:
- At which prices has the highest trading activity occurred?
- Where did buyers and sellers agree the most (High Volume Nodes – HVNs)?
- Where did price move quickly due to low participation (Low Volume Nodes – LVNs)?
### 5.2 Implementation in the Script
Executed only when `show_vp` is enabled and on the last bar:
1. The last `vp_lookback` bars (default 150) are processed.
2. The minimum low and maximum high over this window define the price range.
3. This price range is divided into `vp_rows` segments (e.g., 30 rows).
4. For each row:
- All bars are scanned.
- If the mid-price `(high + low ) / 2` falls inside a row, that bar’s volume is added to the row total.
5. The row with the greatest volume is stored as `max_vol_idx` (the POC row).
6. For each row, a volume box is drawn on the right side of the chart.
### 5.3 Color Scheme
- Semi-transparent Orange
- The row with the maximum volume – the Point of Control (POC).
- Represents the strongest support/resistance level from a volume perspective.
- Semi-transparent Blue
- Other volume rows.
- The taller the bar → the higher the volume → the stronger the interest at that price band.
### 5.4 Trading Applications
- If price is above POC and retraces back into it:
→ POC often acts as support, suitable for long setups.
- If price is below POC and rallies into it:
→ POC often acts as resistance, suitable for short setups or profit-taking.
HVNs (Tall Blue Bars)
- Represent areas of equilibrium where the market has spent time and traded heavily.
- Price tends to consolidate here before choosing a direction.
LVNs (Short or Nearly Empty Bars)
- Represent low participation zones.
- Price often moves quickly through these areas – useful for targeting fast moves.
## Chapter 6 – Wyckoff Helper – Spring
### 6.1 Spring Concept
In the Wyckoff framework:
- A Spring is a false break of support.
- The market briefly trades below a well-defined support level, triggers stop losses,
then sharply reverses upward as institutional buyers absorb liquidity.
This movement:
- Clears out weak hands (retail sellers).
- Provides large players with liquidity to enter long positions.
- Often initiates a new uptrend.
### 6.2 Code Logic
Conditions for a Spring:
1. The current low is lower than the lowest low of the previous 50 bars
→ apparent break of a long-standing support.
2. The bar closes bullish (Close > Open)
→ the breakdown was rejected.
3. Volume is significantly elevated:
→ `volume > 2 × volume_MA` (Ultra Volume).
When all conditions are met and `show_wyc` is enabled:
- A pink diamond is plotted below the bar,
- With the label “Spring” – one of the strongest long signals in this system.
### 6.3 Trading Use
- After a valid Spring, markets frequently enter a meaningful bullish phase.
- The highest quality setups occur when:
- The Spring forms inside a green Order Block, and
- Near or on the Volume Profile POC.
Entries:
- At the close of the Spring bar, or
- On the first pullback into the mid-range of the Spring candle.
Stop-loss:
- Slightly below the Spring’s lowest point (wick low plus a small buffer).
## Chapter 7 – Confluence Engine & Dashboard
### 7.1 Scoring Logic
For each bar, the script:
1. Resets `score` to 0.
2. Adjusts the score based on different signals.
SMC Contribution
if show_smc
if is_in_demand
score += 1
if is_in_supply
score -= 1
- Being in Demand → `+1`
- Being in Supply → `-1`
DCA Contribution
if show_dca
if dca_buy
score += 2
if dca_sell
score -= 2
- DCA Buy → `+2` (strong, statistically driven long signal)
- DCA Sell → `-2`
Wyckoff Spring Contribution
if show_wyc
if wyc_spring
score += 2
- Spring → `+2` (entry of strong money)
### 7.2 Mapping Score to Dashboard Signal
- score ≥ 2 → STRONG LONG 🚀
Multiple bullish conditions aligned.
- score = 1 → WEAK LONG ↗
Some bullish bias, but only one layer clearly positive.
- score = 0 → NEUTRAL / WAIT
Rough balance between buying and selling forces; staying flat is usually preferable.
- score = -1 → WEAK SHORT ↘
Mild bearish bias, suited for cautious or short-term plays.
- score ≤ -2 → STRONG SHORT 🩸
Convergence of several bearish signals.
### 7.3 Dashboard Structure
The dashboard is a two-column table:
- Row 0
- Column 0: `"Mars Signals"` – black background, white text.
- Column 1: `"UIS v3.0"` – black background, yellow text.
- Row 1
- Column 0: `"Price:"` (light grey background).
- Column 1: current closing price (`close`) with a semi-transparent blue background.
- Row 2
- Column 0: `"SMC:"`
- Column 1:
- `"ON"` (green) if `show_smc = true`
- `"OFF"` (grey) otherwise.
- Row 3
- Column 0: `"DCA:"`
- Column 1:
- `"ON"` (green) if `show_dca = true`
- `"OFF"` (grey) otherwise.
- Row 4
- Column 0: `"Signal:"`
- Column 1: signal text (`status_txt`) with background color `status_col`
(green, red, teal, maroon, etc.)
- If `show_rec = false`, these cells are cleared.
## Chapter 8 – Visual Legend (Colors, Shapes & Actions)
For quick reading inside TradingView, the visual elements are described line by line instead of a table.
Chart Element: Green Box
Color / Shape: Transparent green rectangle
Core Meaning: Bullish Order Block (Demand Zone)
Suggested Trader Response: Look for longs, Smart DCA adds, closing or reducing shorts.
Chart Element: Red Box
Color / Shape: Transparent red rectangle
Core Meaning: Bearish Order Block (Supply Zone)
Suggested Trader Response: Look for shorts, or take profit on existing longs.
Chart Element: Yellow Area
Color / Shape: Transparent yellow zone
Core Meaning: Bullish FVG / upside imbalance
Suggested Trader Response: Short take-profit zone or expected rebalance area.
Chart Element: Purple Area
Color / Shape: Transparent purple zone
Core Meaning: Bearish FVG / downside imbalance
Suggested Trader Response: Long take-profit zone or temporary supply region.
Chart Element: Green "DCA" Label
Color / Shape: Green label with white text, plotted below the candle
Core Meaning: Smart ladder-in buy zone, DCA buy opportunity
Suggested Trader Response: Spot DCA entry, partial short exit.
Chart Element: Red "SELL" Label
Color / Shape: Red label with white text, plotted above the candle
Core Meaning: Overbought / distribution zone
Suggested Trader Response: Take profit on longs, consider initiating shorts.
Chart Element: Light Green Background (bgcolor)
Color / Shape: Very transparent light-green background behind bars
Core Meaning: Active DCA Buy zone
Suggested Trader Response: Treat as a discount zone on the chart.
Chart Element: Orange Bar on Right
Color / Shape: Transparent orange horizontal bar in the volume profile
Core Meaning: POC – price with highest traded volume
Suggested Trader Response: Strong support or resistance; key reference level.
Chart Element: Blue Bars on Right
Color / Shape: Transparent blue horizontal bars in the volume profile
Core Meaning: Other volume levels, showing high-volume and low-volume nodes
Suggested Trader Response: Use to identify balance zones (HVN) and fast-move corridors (LVN).
Chart Element: Pink "Spring" Diamond
Color / Shape: Pink diamond with white text below the candle
Core Meaning: Wyckoff Spring – liquidity grab and potential major bullish reversal
Suggested Trader Response: One of the strongest long signals in the suite; look for high-quality long setups with tight risk.
Chart Element: STRONG LONG in Dashboard
Color / Shape: Green background, white text in the Signal row
Core Meaning: Multiple bullish layers in confluence
Suggested Trader Response: Consider initiating or increasing longs with strict risk management.
Chart Element: STRONG SHORT in Dashboard
Color / Shape: Red background, white text in the Signal row
Core Meaning: Multiple bearish layers in confluence
Suggested Trader Response: Consider initiating or increasing shorts with a logical, well-placed stop.
## Chapter 9 – Timeframe-Based Trading Playbook
### 9.1 Timeframe Selection
- Scalping
- Timeframes: 1M, 5M, 15M
- Objective: fast intraday moves (minutes to a few hours).
- Recommendation: focus on SMC + Wyckoff.
Smart DCA on very low timeframes may introduce excessive noise.
- Day Trading
- Timeframes: 15M, 1H, 4H
- Provides a good balance between signal quality and frequency.
- Recommendation: use the full stack – SMC + DCA + Volume Profile + Wyckoff + Dashboard.
- Swing Trading & Position Investing
- Timeframes: Daily, Weekly
- Emphasis on Smart DCA + Volume Profile.
- SMC and Wyckoff are used mainly to fine-tune swing entries within larger trends.
### 9.2 Scenario A – Scalping Long
Example: 5-Minute Chart
1. Price is declining into a green OB (Bullish Demand).
2. A candle with a long lower wick and bullish close (Pin Bar / Rejection) forms inside the OB.
3. A Spring diamond appears below the same candle → very strong confluence.
4. The Dashboard shows at least WEAK LONG ↗, ideally STRONG LONG 🚀.
5. Entry:
- On the close of the confirmation candle, or
- On the first pullback into the mid-range of that candle.
6. Stop-loss:
- Slightly below the OB.
7. Targets:
- Nearby bearish FVG above, and/or
- The next red OB.
### 9.3 Scenario B – Day-Trading Short
Recommended Timeframes: 1H or 4H
1. The market completes a strong impulsive move upward.
2. Price enters a red Order Block (Supply).
3. In the same zone, a purple FVG appears or remains unfilled.
4. On a lower timeframe (e.g., 15M), RSI enters overbought territory and a DCA Sell signal appears.
5. The main timeframe Dashboard (1H) shows WEAK SHORT ↘ or STRONG SHORT 🩸.
Trade Plan
- Open a short near the upper boundary of the red OB.
- Place the stop above the OB or above the last swing high.
- Targets:
- A yellow FVG lower on the chart, and/or
- The next green OB (Demand) below.
### 9.4 Scenario C – Swing / Investment with Smart DCA
Timeframes: Daily / Weekly
1. On the daily or weekly chart, each time a green “DCA” label appears:
- Allocate a fixed fraction of your capital (e.g., 3–5%) to that asset.
2. Check whether this DCA zone aligns with the orange POC of the Volume Profile:
- If yes → the quality of the entry zone is significantly higher.
3. If the DCA signal sits inside a daily green OB, the probability of a medium-term bottom increases.
4. Always build the position laddered, never all-in at a single price.
Exits for investors:
- Near weekly red OBs or large purple FVG zones.
- Ideally via partial profit-taking rather than closing 100% at once.
### 9.5 Case Study 1 – BTCUSDT (15-Minute)
- Context: Price has sold off down towards 65,000 USD.
- A green OB had previously formed at that level.
- Near the lower boundary of this OB, a partially filled yellow FVG is present.
- As price returns to this region, a Spring appears.
- The Dashboard shifts from NEUTRAL / WAIT to WEAK LONG ↗.
Plan
- Enter a long near the OB low.
- Place stop below the Spring low.
- First target: a purple FVG around 66,200.
- Second (optional) target: the first red OB above that level.
### 9.6 Case Study 2 – Meme Coin (PEPE – 4H)
- After a strong pump, price enters a corrective phase.
- On the 4H chart, RSI drops below 30; price breaks below the lower Bollinger Band → a DCA label prints.
- The Volume Profile shows the POC at approximately the same level.
- The Dashboard displays STRONG LONG 🚀.
Plan
- Execute laddered buys in the combined DCA + POC zone.
- Place a protective stop below the last significant swing low.
- Target: an expected 20–30% upside move towards the next red OB or purple FVG.
## Chapter 10 – Risk Management, Psychology & Advanced Tuning
### 10.1 Risk Management
No signal, regardless of its strength, replaces risk control.
Recommendations:
- In futures, do not expose more than 1–3% of account equity to risk per trade.
- Adjust leverage to the volatility of the instrument (lower leverage for highly volatile altcoins).
- Place stop-losses in zones where the idea is clearly invalidated:
- Below/above the relevant Order Block or Spring, not randomly in the middle of the structure.
### 10.2 Market-Specific Parameter Tuning
- Calmer Markets (e.g., major FX pairs)
- `ob_period`: 3–5.
- `bb_mult`: 2.0 is usually sufficient.
- Highly Volatile Markets (Crypto, news-driven assets)
- `ob_period`: 7–10 to highlight only the most robust OBs.
- `bb_mult`: 2.5–3.0 so that only extreme deviations trigger DCA.
- `vol_ma_len`: increase (e.g., to ~30) so that Spring triggers only on truly exceptional
volume spikes.
### 10.3 Trading Psychology
- STRONG LONG 🚀 does not mean “risk-free”.
It means the probability of a successful long, given the model’s logic, is higher than average.
- Treat Mars Signals as a confirmation and context system, not a full replacement for your own decision-making.
- Example of disciplined thinking:
- The Dashboard prints STRONG LONG,
- But price is simultaneously testing a multi-month macro resistance or a major negative news event is imminent,
- In such cases, trade smaller, widen stops appropriately, or skip the trade.
## Chapter 11 – Technical Notes & FAQ
### 11.1 Does the Script Repaint?
- Order Blocks and Springs are based on completed pivot structures and confirmed candles.
- Until a pivot is confirmed, an OB does not exist; after confirmation, behavior is stable under classic SMC assumptions.
- The script is designed to be structurally consistent rather than repainting signals arbitrarily.
### 11.2 Computational Load of Volume Profile
- On the last bar, the script processes up to `vp_lookback` bars × `vp_rows` rows.
- On very low timeframes with heavy zooming, this can become demanding.
- If you experience performance issues:
- Reduce `vp_lookback` or `vp_rows`, or
- Temporarily disable Volume Profile (`show_vp = false`).
### 11.3 Multi-Timeframe Behavior
- This version of the script is not internally multi-timeframe.
All logic (OB, DCA, Spring, Volume Profile) is computed on the active timeframe only.
- Practical workflow:
- Analyze overall structure and key zones on higher timeframes (4H / Daily).
- Use lower timeframes (15M / 1H) with the same tool for timing entries and exits.
## Conclusion
Mars Signals – Ultimate Institutional Suite v3.0 (Joker) is a multi-layer trading framework that unifies:
- Price structure (Order Blocks & FVG),
- Statistical behavior (Smart DCA via RSI + Bollinger),
- Volume distribution by price (Volume Profile with POC, HVN, LVN),
- Liquidity events (Wyckoff Spring),
into a single, coherent system driven by a transparent Confluence Scoring Engine.
The final output is presented in clear, actionable language:
> STRONG LONG / WEAK LONG / NEUTRAL / WEAK SHORT / STRONG SHORT
The system is designed to support professional decision-making, not to replace it.
Used together with strict risk management and disciplined execution,
Mars Signals – UIS v3.0 (Joker) can serve as a central reference manual and operational guide
for your trading workflow, from scalping to swing and investment positioning.

Quantum Rotational Field MappingQuantum Rotational Field Mapping (QRFM):
Phase Coherence Detection Through Complex-Plane Oscillator Analysis
Quantum Rotational Field Mapping applies complex-plane mathematics and phase-space analysis to oscillator ensembles, identifying high-probability trend ignition points by measuring when multiple independent oscillators achieve phase coherence. Unlike traditional multi-oscillator approaches that simply stack indicators or use boolean AND/OR logic, this system converts each oscillator into a rotating phasor (vector) in the complex plane and calculates the Coherence Index (CI) —a mathematical measure of how tightly aligned the ensemble has become—then generates signals only when alignment, phase direction, and pairwise entanglement all converge.
The indicator combines three mathematical frameworks: phasor representation using analytic signal theory to extract phase and amplitude from each oscillator, coherence measurement using vector summation in the complex plane to quantify group alignment, and entanglement analysis that calculates pairwise phase agreement across all oscillator combinations. This creates a multi-dimensional confirmation system that distinguishes between random oscillator noise and genuine regime transitions.
What Makes This Original
Complex-Plane Phasor Framework
This indicator implements classical signal processing mathematics adapted for market oscillators. Each oscillator—whether RSI, MACD, Stochastic, CCI, Williams %R, MFI, ROC, or TSI—is first normalized to a common scale, then converted into a complex-plane representation using an in-phase (I) and quadrature (Q) component. The in-phase component is the oscillator value itself, while the quadrature component is calculated as the first difference (derivative proxy), creating a velocity-aware representation.
From these components, the system extracts:
Phase (φ) : Calculated as φ = atan2(Q, I), representing the oscillator's position in its cycle (mapped to -180° to +180°)
Amplitude (A) : Calculated as A = √(I² + Q²), representing the oscillator's strength or conviction
This mathematical approach is fundamentally different from simply reading oscillator values. A phasor captures both where an oscillator is in its cycle (phase angle) and how strongly it's expressing that position (amplitude). Two oscillators can have the same value but be in opposite phases of their cycles—traditional analysis would see them as identical, while QRFM sees them as 180° out of phase (contradictory).
Coherence Index Calculation
The core innovation is the Coherence Index (CI) , borrowed from physics and signal processing. When you have N oscillators, each with phase φₙ, you can represent each as a unit vector in the complex plane: e^(iφₙ) = cos(φₙ) + i·sin(φₙ).
The CI measures what happens when you sum all these vectors:
Resultant Vector : R = Σ e^(iφₙ) = Σ cos(φₙ) + i·Σ sin(φₙ)
Coherence Index : CI = |R| / N
Where |R| is the magnitude of the resultant vector and N is the number of active oscillators.
The CI ranges from 0 to 1:
CI = 1.0 : Perfect coherence—all oscillators have identical phase angles, vectors point in the same direction, creating maximum constructive interference
CI = 0.0 : Complete decoherence—oscillators are randomly distributed around the circle, vectors cancel out through destructive interference
0 < CI < 1 : Partial alignment—some clustering with some scatter
This is not a simple average or correlation. The CI captures phase synchronization across the entire ensemble simultaneously. When oscillators phase-lock (align their cycles), the CI spikes regardless of their individual values. This makes it sensitive to regime transitions that traditional indicators miss.
Dominant Phase and Direction Detection
Beyond measuring alignment strength, the system calculates the dominant phase of the ensemble—the direction the resultant vector points:
Dominant Phase : φ_dom = atan2(Σ sin(φₙ), Σ cos(φₙ))
This gives the "average direction" of all oscillator phases, mapped to -180° to +180°:
+90° to -90° (right half-plane): Bullish phase dominance
+90° to +180° or -90° to -180° (left half-plane): Bearish phase dominance
The combination of CI magnitude (coherence strength) and dominant phase angle (directional bias) creates a two-dimensional signal space. High CI alone is insufficient—you need high CI plus dominant phase pointing in a tradeable direction. This dual requirement is what separates QRFM from simple oscillator averaging.
Entanglement Matrix and Pairwise Coherence
While the CI measures global alignment, the entanglement matrix measures local pairwise relationships. For every pair of oscillators (i, j), the system calculates:
E(i,j) = |cos(φᵢ - φⱼ)|
This represents the phase agreement between oscillators i and j:
E = 1.0 : Oscillators are in-phase (0° or 360° apart)
E = 0.0 : Oscillators are in quadrature (90° apart, orthogonal)
E between 0 and 1 : Varying degrees of alignment
The system counts how many oscillator pairs exceed a user-defined entanglement threshold (e.g., 0.7). This entangled pairs count serves as a confirmation filter: signals require not just high global CI, but also a minimum number of strong pairwise agreements. This prevents false ignitions where CI is high but driven by only two oscillators while the rest remain scattered.
The entanglement matrix creates an N×N symmetric matrix that can be visualized as a web—when many cells are bright (high E values), the ensemble is highly interconnected. When cells are dark, oscillators are moving independently.
Phase-Lock Tolerance Mechanism
A complementary confirmation layer is the phase-lock detector . This calculates the maximum phase spread across all oscillators:
For all pairs (i,j), compute angular distance: Δφ = |φᵢ - φⱼ|, wrapping at 180°
Max Spread = maximum Δφ across all pairs
If max spread < user threshold (e.g., 35°), the ensemble is considered phase-locked —all oscillators are within a narrow angular band.
This differs from entanglement: entanglement measures pairwise cosine similarity (magnitude of alignment), while phase-lock measures maximum angular deviation (tightness of clustering). Both must be satisfied for the highest-conviction signals.
Multi-Layer Visual Architecture
QRFM includes six visual components that represent the same underlying mathematics from different perspectives:
Circular Orbit Plot : A polar coordinate grid showing each oscillator as a vector from origin to perimeter. Angle = phase, radius = amplitude. This is a real-time snapshot of the complex plane. When vectors converge (point in similar directions), coherence is high. When scattered randomly, coherence is low. Users can see phase alignment forming before CI numerically confirms it.
Phase-Time Heat Map : A 2D matrix with rows = oscillators and columns = time bins. Each cell is colored by the oscillator's phase at that time (using a gradient where color hue maps to angle). Horizontal color bands indicate sustained phase alignment over time. Vertical color bands show moments when all oscillators shared the same phase (ignition points). This provides historical pattern recognition.
Entanglement Web Matrix : An N×N grid showing E(i,j) for all pairs. Cells are colored by entanglement strength—bright yellow/gold for high E, dark gray for low E. This reveals which oscillators are driving coherence and which are lagging. For example, if RSI and MACD show high E but Stochastic shows low E with everything, Stochastic is the outlier.
Quantum Field Cloud : A background color overlay on the price chart. Color (green = bullish, red = bearish) is determined by dominant phase. Opacity is determined by CI—high CI creates dense, opaque cloud; low CI creates faint, nearly invisible cloud. This gives an atmospheric "feel" for regime strength without looking at numbers.
Phase Spiral : A smoothed plot of dominant phase over recent history, displayed as a curve that wraps around price. When the spiral is tight and rotating steadily, the ensemble is in coherent rotation (trending). When the spiral is loose or erratic, coherence is breaking down.
Dashboard : A table showing real-time metrics: CI (as percentage), dominant phase (in degrees with directional arrow), field strength (CI × average amplitude), entangled pairs count, phase-lock status (locked/unlocked), quantum state classification ("Ignition", "Coherent", "Collapse", "Chaos"), and collapse risk (recent CI change normalized to 0-100%).
Each component is independently toggleable, allowing users to customize their workspace. The orbit plot is the most essential—it provides intuitive, visual feedback on phase alignment that no numerical dashboard can match.
Core Components and How They Work Together
1. Oscillator Normalization Engine
The foundation is creating a common measurement scale. QRFM supports eight oscillators:
RSI : Normalized from to using overbought/oversold levels (70, 30) as anchors
MACD Histogram : Normalized by dividing by rolling standard deviation, then clamped to
Stochastic %K : Normalized from using (80, 20) anchors
CCI : Divided by 200 (typical extreme level), clamped to
Williams %R : Normalized from using (-20, -80) anchors
MFI : Normalized from using (80, 20) anchors
ROC : Divided by 10, clamped to
TSI : Divided by 50, clamped to
Each oscillator can be individually enabled/disabled. Only active oscillators contribute to phase calculations. The normalization removes scale differences—a reading of +0.8 means "strongly bullish" regardless of whether it came from RSI or TSI.
2. Analytic Signal Construction
For each active oscillator at each bar, the system constructs the analytic signal:
In-Phase (I) : The normalized oscillator value itself
Quadrature (Q) : The bar-to-bar change in the normalized value (first derivative approximation)
This creates a 2D representation: (I, Q). The phase is extracted as:
φ = atan2(Q, I) × (180 / π)
This maps the oscillator to a point on the unit circle. An oscillator at the same value but rising (positive Q) will have a different phase than one that is falling (negative Q). This velocity-awareness is critical—it distinguishes between "at resistance and stalling" versus "at resistance and breaking through."
The amplitude is extracted as:
A = √(I² + Q²)
This represents the distance from origin in the (I, Q) plane. High amplitude means the oscillator is far from neutral (strong conviction). Low amplitude means it's near zero (weak/transitional state).
3. Coherence Calculation Pipeline
For each bar (or every Nth bar if phase sample rate > 1 for performance):
Step 1 : Extract phase φₙ for each of the N active oscillators
Step 2 : Compute complex exponentials: Zₙ = e^(i·φₙ·π/180) = cos(φₙ·π/180) + i·sin(φₙ·π/180)
Step 3 : Sum the complex exponentials: R = Σ Zₙ = (Σ cos φₙ) + i·(Σ sin φₙ)
Step 4 : Calculate magnitude: |R| = √
Step 5 : Normalize by count: CI_raw = |R| / N
Step 6 : Smooth the CI: CI = SMA(CI_raw, smoothing_window)
The smoothing step (default 2 bars) removes single-bar noise spikes while preserving structural coherence changes. Users can adjust this to control reactivity versus stability.
The dominant phase is calculated as:
φ_dom = atan2(Σ sin φₙ, Σ cos φₙ) × (180 / π)
This is the angle of the resultant vector R in the complex plane.
4. Entanglement Matrix Construction
For all unique pairs of oscillators (i, j) where i < j:
Step 1 : Get phases φᵢ and φⱼ
Step 2 : Compute phase difference: Δφ = φᵢ - φⱼ (in radians)
Step 3 : Calculate entanglement: E(i,j) = |cos(Δφ)|
Step 4 : Store in symmetric matrix: matrix = matrix = E(i,j)
The matrix is then scanned: count how many E(i,j) values exceed the user-defined threshold (default 0.7). This count is the entangled pairs metric.
For visualization, the matrix is rendered as an N×N table where cell brightness maps to E(i,j) intensity.
5. Phase-Lock Detection
Step 1 : For all unique pairs (i, j), compute angular distance: Δφ = |φᵢ - φⱼ|
Step 2 : Wrap angles: if Δφ > 180°, set Δφ = 360° - Δφ
Step 3 : Find maximum: max_spread = max(Δφ) across all pairs
Step 4 : Compare to tolerance: phase_locked = (max_spread < tolerance)
If phase_locked is true, all oscillators are within the specified angular cone (e.g., 35°). This is a boolean confirmation filter.
6. Signal Generation Logic
Signals are generated through multi-layer confirmation:
Long Ignition Signal :
CI crosses above ignition threshold (e.g., 0.80)
AND dominant phase is in bullish range (-90° < φ_dom < +90°)
AND phase_locked = true
AND entangled_pairs >= minimum threshold (e.g., 4)
Short Ignition Signal :
CI crosses above ignition threshold
AND dominant phase is in bearish range (φ_dom < -90° OR φ_dom > +90°)
AND phase_locked = true
AND entangled_pairs >= minimum threshold
Collapse Signal :
CI at bar minus CI at current bar > collapse threshold (e.g., 0.55)
AND CI at bar was above 0.6 (must collapse from coherent state, not from already-low state)
These are strict conditions. A high CI alone does not generate a signal—dominant phase must align with direction, oscillators must be phase-locked, and sufficient pairwise entanglement must exist. This multi-factor gating dramatically reduces false signals compared to single-condition triggers.
Calculation Methodology
Phase 1: Oscillator Computation and Normalization
On each bar, the system calculates the raw values for all enabled oscillators using standard Pine Script functions:
RSI: ta.rsi(close, length)
MACD: ta.macd() returning histogram component
Stochastic: ta.stoch() smoothed with ta.sma()
CCI: ta.cci(close, length)
Williams %R: ta.wpr(length)
MFI: ta.mfi(hlc3, length)
ROC: ta.roc(close, length)
TSI: ta.tsi(close, short, long)
Each raw value is then passed through a normalization function:
normalize(value, overbought_level, oversold_level) = 2 × (value - oversold) / (overbought - oversold) - 1
This maps the oscillator's typical range to , where -1 represents extreme bearish, 0 represents neutral, and +1 represents extreme bullish.
For oscillators without fixed ranges (MACD, ROC, TSI), statistical normalization is used: divide by a rolling standard deviation or fixed divisor, then clamp to .
Phase 2: Phasor Extraction
For each normalized oscillator value val:
I = val (in-phase component)
Q = val - val (quadrature component, first difference)
Phase calculation:
phi_rad = atan2(Q, I)
phi_deg = phi_rad × (180 / π)
Amplitude calculation:
A = √(I² + Q²)
These values are stored in arrays: osc_phases and osc_amps for each oscillator n.
Phase 3: Complex Summation and Coherence
Initialize accumulators:
sum_cos = 0
sum_sin = 0
For each oscillator n = 0 to N-1:
phi_rad = osc_phases × (π / 180)
sum_cos += cos(phi_rad)
sum_sin += sin(phi_rad)
Resultant magnitude:
resultant_mag = √(sum_cos² + sum_sin²)
Coherence Index (raw):
CI_raw = resultant_mag / N
Smoothed CI:
CI = SMA(CI_raw, smoothing_window)
Dominant phase:
phi_dom_rad = atan2(sum_sin, sum_cos)
phi_dom_deg = phi_dom_rad × (180 / π)
Phase 4: Entanglement Matrix Population
For i = 0 to N-2:
For j = i+1 to N-1:
phi_i = osc_phases × (π / 180)
phi_j = osc_phases × (π / 180)
delta_phi = phi_i - phi_j
E = |cos(delta_phi)|
matrix_index_ij = i × N + j
matrix_index_ji = j × N + i
entangle_matrix = E
entangle_matrix = E
if E >= threshold:
entangled_pairs += 1
The matrix uses flat array storage with index mapping: index(row, col) = row × N + col.
Phase 5: Phase-Lock Check
max_spread = 0
For i = 0 to N-2:
For j = i+1 to N-1:
delta = |osc_phases - osc_phases |
if delta > 180:
delta = 360 - delta
max_spread = max(max_spread, delta)
phase_locked = (max_spread < tolerance)
Phase 6: Signal Evaluation
Ignition Long :
ignition_long = (CI crosses above threshold) AND
(phi_dom > -90 AND phi_dom < 90) AND
phase_locked AND
(entangled_pairs >= minimum)
Ignition Short :
ignition_short = (CI crosses above threshold) AND
(phi_dom < -90 OR phi_dom > 90) AND
phase_locked AND
(entangled_pairs >= minimum)
Collapse :
CI_prev = CI
collapse = (CI_prev - CI > collapse_threshold) AND (CI_prev > 0.6)
All signals are evaluated on bar close. The crossover and crossunder functions ensure signals fire only once when conditions transition from false to true.
Phase 7: Field Strength and Visualization Metrics
Average Amplitude :
avg_amp = (Σ osc_amps ) / N
Field Strength :
field_strength = CI × avg_amp
Collapse Risk (for dashboard):
collapse_risk = (CI - CI) / max(CI , 0.1)
collapse_risk_pct = clamp(collapse_risk × 100, 0, 100)
Quantum State Classification :
if (CI > threshold AND phase_locked):
state = "Ignition"
else if (CI > 0.6):
state = "Coherent"
else if (collapse):
state = "Collapse"
else:
state = "Chaos"
Phase 8: Visual Rendering
Orbit Plot : For each oscillator, convert polar (phase, amplitude) to Cartesian (x, y) for grid placement:
radius = amplitude × grid_center × 0.8
x = radius × cos(phase × π/180)
y = radius × sin(phase × π/180)
col = center + x (mapped to grid coordinates)
row = center - y
Heat Map : For each oscillator row and time column, retrieve historical phase value at lookback = (columns - col) × sample_rate, then map phase to color using a hue gradient.
Entanglement Web : Render matrix as table cell with background color opacity = E(i,j).
Field Cloud : Background color = (phi_dom > -90 AND phi_dom < 90) ? green : red, with opacity = mix(min_opacity, max_opacity, CI).
All visual components render only on the last bar (barstate.islast) to minimize computational overhead.
How to Use This Indicator
Step 1 : Apply QRFM to your chart. It works on all timeframes and asset classes, though 15-minute to 4-hour timeframes provide the best balance of responsiveness and noise reduction.
Step 2 : Enable the dashboard (default: top right) and the circular orbit plot (default: middle left). These are your primary visual feedback tools.
Step 3 : Optionally enable the heat map, entanglement web, and field cloud based on your preference. New users may find all visuals overwhelming; start with dashboard + orbit plot.
Step 4 : Observe for 50-100 bars to let the indicator establish baseline coherence patterns. Markets have different "normal" CI ranges—some instruments naturally run higher or lower coherence.
Understanding the Circular Orbit Plot
The orbit plot is a polar grid showing oscillator vectors in real-time:
Center point : Neutral (zero phase and amplitude)
Each vector : A line from center to a point on the grid
Vector angle : The oscillator's phase (0° = right/east, 90° = up/north, 180° = left/west, -90° = down/south)
Vector length : The oscillator's amplitude (short = weak signal, long = strong signal)
Vector label : First letter of oscillator name (R = RSI, M = MACD, etc.)
What to watch :
Convergence : When all vectors cluster in one quadrant or sector, CI is rising and coherence is forming. This is your pre-signal warning.
Scatter : When vectors point in random directions (360° spread), CI is low and the market is in a non-trending or transitional regime.
Rotation : When the cluster rotates smoothly around the circle, the ensemble is in coherent oscillation—typically seen during steady trends.
Sudden flips : When the cluster rapidly jumps from one side to the opposite (e.g., +90° to -90°), a phase reversal has occurred—often coinciding with trend reversals.
Example: If you see RSI, MACD, and Stochastic all pointing toward 45° (northeast) with long vectors, while CCI, TSI, and ROC point toward 40-50° as well, coherence is high and dominant phase is bullish. Expect an ignition signal if CI crosses threshold.
Reading Dashboard Metrics
The dashboard provides numerical confirmation of what the orbit plot shows visually:
CI : Displays as 0-100%. Above 70% = high coherence (strong regime), 40-70% = moderate, below 40% = low (poor conditions for trend entries).
Dom Phase : Angle in degrees with directional arrow. ⬆ = bullish bias, ⬇ = bearish bias, ⬌ = neutral.
Field Strength : CI weighted by amplitude. High values (> 0.6) indicate not just alignment but strong alignment.
Entangled Pairs : Count of oscillator pairs with E > threshold. Higher = more confirmation. If minimum is set to 4, you need at least 4 pairs entangled for signals.
Phase Lock : 🔒 YES (all oscillators within tolerance) or 🔓 NO (spread too wide).
State : Real-time classification:
🚀 IGNITION: CI just crossed threshold with phase-lock
⚡ COHERENT: CI is high and stable
💥 COLLAPSE: CI has dropped sharply
🌀 CHAOS: Low CI, scattered phases
Collapse Risk : 0-100% scale based on recent CI change. Above 50% warns of imminent breakdown.
Interpreting Signals
Long Ignition (Blue Triangle Below Price) :
Occurs when CI crosses above threshold (e.g., 0.80)
Dominant phase is in bullish range (-90° to +90°)
All oscillators are phase-locked (within tolerance)
Minimum entangled pairs requirement met
Interpretation : The oscillator ensemble has transitioned from disorder to coherent bullish alignment. This is a high-probability long entry point. The multi-layer confirmation (CI + phase direction + lock + entanglement) ensures this is not a single-oscillator whipsaw.
Short Ignition (Red Triangle Above Price) :
Same conditions as long, but dominant phase is in bearish range (< -90° or > +90°)
Interpretation : Coherent bearish alignment has formed. High-probability short entry.
Collapse (Circles Above and Below Price) :
CI has dropped by more than the collapse threshold (e.g., 0.55) over a 5-bar window
CI was previously above 0.6 (collapsing from coherent state)
Interpretation : Phase coherence has broken down. If you are in a position, this is an exit warning. If looking to enter, stand aside—regime is transitioning.
Phase-Time Heat Map Patterns
Enable the heat map and position it at bottom right. The rows represent individual oscillators, columns represent time bins (most recent on left).
Pattern: Horizontal Color Bands
If a row (e.g., RSI) shows consistent color across columns (say, green for several bins), that oscillator has maintained stable phase over time. If all rows show horizontal bands of similar color, the entire ensemble has been phase-locked for an extended period—this is a strong trending regime.
Pattern: Vertical Color Bands
If a column (single time bin) shows all cells with the same or very similar color, that moment in time had high coherence. These vertical bands often align with ignition signals or major price pivots.
Pattern: Rainbow Chaos
If cells are random colors (red, green, yellow mixed with no pattern), coherence is low. The ensemble is scattered. Avoid trading during these periods unless you have external confirmation.
Pattern: Color Transition
If you see a row transition from red to green (or vice versa) sharply, that oscillator has phase-flipped. If multiple rows do this simultaneously, a regime change is underway.
Entanglement Web Analysis
Enable the web matrix (default: opposite corner from heat map). It shows an N×N grid where N = number of active oscillators.
Bright Yellow/Gold Cells : High pairwise entanglement. For example, if the RSI-MACD cell is bright gold, those two oscillators are moving in phase. If the RSI-Stochastic cell is bright, they are entangled as well.
Dark Gray Cells : Low entanglement. Oscillators are decorrelated or in quadrature.
Diagonal : Always marked with "—" because an oscillator is always perfectly entangled with itself.
How to use :
Scan for clustering: If most cells are bright, coherence is high across the board. If only a few cells are bright, coherence is driven by a subset (e.g., RSI and MACD are aligned, but nothing else is—weak signal).
Identify laggards: If one row/column is entirely dark, that oscillator is the outlier. You may choose to disable it or monitor for when it joins the group (late confirmation).
Watch for web formation: During low-coherence periods, the matrix is mostly dark. As coherence builds, cells begin lighting up. A sudden "web" of connections forming visually precedes ignition signals.
Trading Workflow
Step 1: Monitor Coherence Level
Check the dashboard CI metric or observe the orbit plot. If CI is below 40% and vectors are scattered, conditions are poor for trend entries. Wait.
Step 2: Detect Coherence Building
When CI begins rising (say, from 30% to 50-60%) and you notice vectors on the orbit plot starting to cluster, coherence is forming. This is your alert phase—do not enter yet, but prepare.
Step 3: Confirm Phase Direction
Check the dominant phase angle and the orbit plot quadrant where clustering is occurring:
Clustering in right half (0° to ±90°): Bullish bias forming
Clustering in left half (±90° to 180°): Bearish bias forming
Verify the dashboard shows the corresponding directional arrow (⬆ or ⬇).
Step 4: Wait for Signal Confirmation
Do not enter based on rising CI alone. Wait for the full ignition signal:
CI crosses above threshold
Phase-lock indicator shows 🔒 YES
Entangled pairs count >= minimum
Directional triangle appears on chart
This ensures all layers have aligned.
Step 5: Execute Entry
Long : Blue triangle below price appears → enter long
Short : Red triangle above price appears → enter short
Step 6: Position Management
Initial Stop : Place stop loss based on your risk management rules (e.g., recent swing low/high, ATR-based buffer).
Monitoring :
Watch the field cloud density. If it remains opaque and colored in your direction, the regime is intact.
Check dashboard collapse risk. If it rises above 50%, prepare for exit.
Monitor the orbit plot. If vectors begin scattering or the cluster flips to the opposite side, coherence is breaking.
Exit Triggers :
Collapse signal fires (circles appear)
Dominant phase flips to opposite half-plane
CI drops below 40% (coherence lost)
Price hits your profit target or trailing stop
Step 7: Post-Exit Analysis
After exiting, observe whether a new ignition forms in the opposite direction (reversal) or if CI remains low (transition to range). Use this to decide whether to re-enter, reverse, or stand aside.
Best Practices
Use Price Structure as Context
QRFM identifies when coherence forms but does not specify where price will go. Combine ignition signals with support/resistance levels, trendlines, or chart patterns. For example:
Long ignition near a major support level after a pullback: high-probability bounce
Long ignition in the middle of a range with no structure: lower probability
Multi-Timeframe Confirmation
Open QRFM on two timeframes simultaneously:
Higher timeframe (e.g., 4-hour): Use CI level to determine regime bias. If 4H CI is above 60% and dominant phase is bullish, the market is in a bullish regime.
Lower timeframe (e.g., 15-minute): Execute entries on ignition signals that align with the higher timeframe bias.
This prevents counter-trend trades and increases win rate.
Distinguish Between Regime Types
High CI, stable dominant phase (State: Coherent) : Trending market. Ignitions are continuation signals; collapses are profit-taking or reversal warnings.
Low CI, erratic dominant phase (State: Chaos) : Ranging or choppy market. Avoid ignition signals or reduce position size. Wait for coherence to establish.
Moderate CI with frequent collapses : Whipsaw environment. Use wider stops or stand aside.
Adjust Parameters to Instrument and Timeframe
Crypto/Forex (high volatility) : Lower ignition threshold (0.65-0.75), lower CI smoothing (2-3), shorter oscillator lengths (7-10).
Stocks/Indices (moderate volatility) : Standard settings (threshold 0.75-0.85, smoothing 5-7, oscillator lengths 14).
Lower timeframes (5-15 min) : Reduce phase sample rate to 1-2 for responsiveness.
Higher timeframes (daily+) : Increase CI smoothing and oscillator lengths for noise reduction.
Use Entanglement Count as Conviction Filter
The minimum entangled pairs setting controls signal strictness:
Low (1-2) : More signals, lower quality (acceptable if you have other confirmation)
Medium (3-5) : Balanced (recommended for most traders)
High (6+) : Very strict, fewer signals, highest quality
Adjust based on your trade frequency preference and risk tolerance.
Monitor Oscillator Contribution
Use the entanglement web to see which oscillators are driving coherence. If certain oscillators are consistently dark (low E with all others), they may be adding noise. Consider disabling them. For example:
On low-volume instruments, MFI may be unreliable → disable MFI
On strongly trending instruments, mean-reversion oscillators (Stochastic, RSI) may lag → reduce weight or disable
Respect the Collapse Signal
Collapse events are early warnings. Price may continue in the original direction for several bars after collapse fires, but the underlying regime has weakened. Best practice:
If in profit: Take partial or full profit on collapse
If at breakeven/small loss: Exit immediately
If collapse occurs shortly after entry: Likely a false ignition; exit to avoid drawdown
Collapses do not guarantee immediate reversals—they signal uncertainty .
Combine with Volume Analysis
If your instrument has reliable volume:
Ignitions with expanding volume: Higher conviction
Ignitions with declining volume: Weaker, possibly false
Collapses with volume spikes: Strong reversal signal
Collapses with low volume: May just be consolidation
Volume is not built into QRFM (except via MFI), so add it as external confirmation.
Observe the Phase Spiral
The spiral provides a quick visual cue for rotation consistency:
Tight, smooth spiral : Ensemble is rotating coherently (trending)
Loose, erratic spiral : Phase is jumping around (ranging or transitional)
If the spiral tightens, coherence is building. If it loosens, coherence is dissolving.
Do Not Overtrade Low-Coherence Periods
When CI is persistently below 40% and the state is "Chaos," the market is not in a regime where phase analysis is predictive. During these times:
Reduce position size
Widen stops
Wait for coherence to return
QRFM's strength is regime detection. If there is no regime, the tool correctly signals "stand aside."
Use Alerts Strategically
Set alerts for:
Long Ignition
Short Ignition
Collapse
Phase Lock (optional)
Configure alerts to "Once per bar close" to avoid intrabar repainting and noise. When an alert fires, manually verify:
Orbit plot shows clustering
Dashboard confirms all conditions
Price structure supports the trade
Do not blindly trade alerts—use them as prompts for analysis.
Ideal Market Conditions
Best Performance
Instruments :
Liquid, actively traded markets (major forex pairs, large-cap stocks, major indices, top-tier crypto)
Instruments with clear cyclical oscillator behavior (avoid extremely illiquid or manipulated markets)
Timeframes :
15-minute to 4-hour: Optimal balance of noise reduction and responsiveness
1-hour to daily: Slower, higher-conviction signals; good for swing trading
5-minute: Acceptable for scalping if parameters are tightened and you accept more noise
Market Regimes :
Trending markets with periodic retracements (where oscillators cycle through phases predictably)
Breakout environments (coherence forms before/during breakout; collapse occurs at exhaustion)
Rotational markets with clear swings (oscillators phase-lock at turning points)
Volatility :
Moderate to high volatility (oscillators have room to move through their ranges)
Stable volatility regimes (sudden VIX spikes or flash crashes may create false collapses)
Challenging Conditions
Instruments :
Very low liquidity markets (erratic price action creates unstable oscillator phases)
Heavily news-driven instruments (fundamentals may override technical coherence)
Highly correlated instruments (oscillators may all reflect the same underlying factor, reducing independence)
Market Regimes :
Deep, prolonged consolidation (oscillators remain near neutral, CI is chronically low, few signals fire)
Extreme chop with no directional bias (oscillators whipsaw, coherence never establishes)
Gap-driven markets (large overnight gaps create phase discontinuities)
Timeframes :
Sub-5-minute charts: Noise dominates; oscillators flip rapidly; coherence is fleeting and unreliable
Weekly/monthly: Oscillators move extremely slowly; signals are rare; better suited for long-term positioning than active trading
Special Cases :
During major economic releases or earnings: Oscillators may lag price or become decorrelated as fundamentals overwhelm technicals. Reduce position size or stand aside.
In extremely low-volatility environments (e.g., holiday periods): Oscillators compress to neutral, CI may be artificially high due to lack of movement, but signals lack follow-through.
Adaptive Behavior
QRFM is designed to self-adapt to poor conditions:
When coherence is genuinely absent, CI remains low and signals do not fire
When only a subset of oscillators aligns, entangled pairs count stays below threshold and signals are filtered out
When phase-lock cannot be achieved (oscillators too scattered), the lock filter prevents signals
This means the indicator will naturally produce fewer (or zero) signals during unfavorable conditions, rather than generating false signals. This is a feature —it keeps you out of low-probability trades.
Parameter Optimization by Trading Style
Scalping (5-15 Minute Charts)
Goal : Maximum responsiveness, accept higher noise
Oscillator Lengths :
RSI: 7-10
MACD: 8/17/6
Stochastic: 8-10, smooth 2-3
CCI: 14-16
Others: 8-12
Coherence Settings :
CI Smoothing Window: 2-3 bars (fast reaction)
Phase Sample Rate: 1 (every bar)
Ignition Threshold: 0.65-0.75 (lower for more signals)
Collapse Threshold: 0.40-0.50 (earlier exit warnings)
Confirmation :
Phase Lock Tolerance: 40-50° (looser, easier to achieve)
Min Entangled Pairs: 2-3 (fewer oscillators required)
Visuals :
Orbit Plot + Dashboard only (reduce screen clutter for fast decisions)
Disable heavy visuals (heat map, web) for performance
Alerts :
Enable all ignition and collapse alerts
Set to "Once per bar close"
Day Trading (15-Minute to 1-Hour Charts)
Goal : Balance between responsiveness and reliability
Oscillator Lengths :
RSI: 14 (standard)
MACD: 12/26/9 (standard)
Stochastic: 14, smooth 3
CCI: 20
Others: 10-14
Coherence Settings :
CI Smoothing Window: 3-5 bars (balanced)
Phase Sample Rate: 2-3
Ignition Threshold: 0.75-0.85 (moderate selectivity)
Collapse Threshold: 0.50-0.55 (balanced exit timing)
Confirmation :
Phase Lock Tolerance: 30-40° (moderate tightness)
Min Entangled Pairs: 4-5 (reasonable confirmation)
Visuals :
Orbit Plot + Dashboard + Heat Map or Web (choose one)
Field Cloud for regime backdrop
Alerts :
Ignition and collapse alerts
Optional phase-lock alert for advance warning
Swing Trading (4-Hour to Daily Charts)
Goal : High-conviction signals, minimal noise, fewer trades
Oscillator Lengths :
RSI: 14-21
MACD: 12/26/9 or 19/39/9 (longer variant)
Stochastic: 14-21, smooth 3-5
CCI: 20-30
Others: 14-20
Coherence Settings :
CI Smoothing Window: 5-10 bars (very smooth)
Phase Sample Rate: 3-5
Ignition Threshold: 0.80-0.90 (high bar for entry)
Collapse Threshold: 0.55-0.65 (only significant breakdowns)
Confirmation :
Phase Lock Tolerance: 20-30° (tight clustering required)
Min Entangled Pairs: 5-7 (strong confirmation)
Visuals :
All modules enabled (you have time to analyze)
Heat Map for multi-bar pattern recognition
Web for deep confirmation analysis
Alerts :
Ignition and collapse
Review manually before entering (no rush)
Position/Long-Term Trading (Daily to Weekly Charts)
Goal : Rare, very high-conviction regime shifts
Oscillator Lengths :
RSI: 21-30
MACD: 19/39/9 or 26/52/12
Stochastic: 21, smooth 5
CCI: 30-50
Others: 20-30
Coherence Settings :
CI Smoothing Window: 10-14 bars
Phase Sample Rate: 5 (every 5th bar to reduce computation)
Ignition Threshold: 0.85-0.95 (only extreme alignment)
Collapse Threshold: 0.60-0.70 (major regime breaks only)
Confirmation :
Phase Lock Tolerance: 15-25° (very tight)
Min Entangled Pairs: 6+ (broad consensus required)
Visuals :
Dashboard + Orbit Plot for quick checks
Heat Map to study historical coherence patterns
Web to verify deep entanglement
Alerts :
Ignition only (collapses are less critical on long timeframes)
Manual review with fundamental analysis overlay
Performance Optimization (Low-End Systems)
If you experience lag or slow rendering:
Reduce Visual Load :
Orbit Grid Size: 8-10 (instead of 12+)
Heat Map Time Bins: 5-8 (instead of 10+)
Disable Web Matrix entirely if not needed
Disable Field Cloud and Phase Spiral
Reduce Calculation Frequency :
Phase Sample Rate: 5-10 (calculate every 5-10 bars)
Max History Depth: 100-200 (instead of 500+)
Disable Unused Oscillators :
If you only want RSI, MACD, and Stochastic, disable the other five. Fewer oscillators = smaller matrices, faster loops.
Simplify Dashboard :
Choose "Small" dashboard size
Reduce number of metrics displayed
These settings will not significantly degrade signal quality (signals are based on bar-close calculations, which remain accurate), but will improve chart responsiveness.
Important Disclaimers
This indicator is a technical analysis tool designed to identify periods of phase coherence across an ensemble of oscillators. It is not a standalone trading system and does not guarantee profitable trades. The Coherence Index, dominant phase, and entanglement metrics are mathematical calculations applied to historical price data—they measure past oscillator behavior and do not predict future price movements with certainty.
No Predictive Guarantee : High coherence indicates that oscillators are currently aligned, which historically has coincided with trending or directional price movement. However, past alignment does not guarantee future trends. Markets can remain coherent while prices consolidate, or lose coherence suddenly due to news, liquidity changes, or other factors not captured by oscillator mathematics.
Signal Confirmation is Probabilistic : The multi-layer confirmation system (CI threshold + dominant phase + phase-lock + entanglement) is designed to filter out low-probability setups. This increases the proportion of valid signals relative to false signals, but does not eliminate false signals entirely. Users should combine QRFM with additional analysis—support and resistance levels, volume confirmation, multi-timeframe alignment, and fundamental context—before executing trades.
Collapse Signals are Warnings, Not Reversals : A coherence collapse indicates that the oscillator ensemble has lost alignment. This often precedes trend exhaustion or reversals, but can also occur during healthy pullbacks or consolidations. Price may continue in the original direction after a collapse. Use collapses as risk management cues (tighten stops, take partial profits) rather than automatic reversal entries.
Market Regime Dependency : QRFM performs best in markets where oscillators exhibit cyclical, mean-reverting behavior and where trends are punctuated by retracements. In markets dominated by fundamental shocks, gap openings, or extreme low-liquidity conditions, oscillator coherence may be less reliable. During such periods, reduce position size or stand aside.
Risk Management is Essential : All trading involves risk of loss. Use appropriate stop losses, position sizing, and risk-per-trade limits. The indicator does not specify stop loss or take profit levels—these must be determined by the user based on their risk tolerance and account size. Never risk more than you can afford to lose.
Parameter Sensitivity : The indicator's behavior changes with input parameters. Aggressive settings (low thresholds, loose tolerances) produce more signals with lower average quality. Conservative settings (high thresholds, tight tolerances) produce fewer signals with higher average quality. Users should backtest and forward-test parameter sets on their specific instruments and timeframes before committing real capital.
No Repainting by Design : All signal conditions are evaluated on bar close using bar-close values. However, the visual components (orbit plot, heat map, dashboard) update in real-time during bar formation for monitoring purposes. For trade execution, rely on the confirmed signals (triangles and circles) that appear only after the bar closes.
Computational Load : QRFM performs extensive calculations, including nested loops for entanglement matrices and real-time table rendering. On lower-powered devices or when running multiple indicators simultaneously, users may experience lag. Use the performance optimization settings (reduce visual complexity, increase phase sample rate, disable unused oscillators) to improve responsiveness.
This system is most effective when used as one component within a broader trading methodology that includes sound risk management, multi-timeframe analysis, market context awareness, and disciplined execution. It is a tool for regime detection and signal confirmation, not a substitute for comprehensive trade planning.
Technical Notes
Calculation Timing : All signal logic (ignition, collapse) is evaluated using bar-close values. The barstate.isconfirmed or implicit bar-close behavior ensures signals do not repaint. Visual components (tables, plots) render on every tick for real-time feedback but do not affect signal generation.
Phase Wrapping : Phase angles are calculated in the range -180° to +180° using atan2. Angular distance calculations account for wrapping (e.g., the distance between +170° and -170° is 20°, not 340°). This ensures phase-lock detection works correctly across the ±180° boundary.
Array Management : The indicator uses fixed-size arrays for oscillator phases, amplitudes, and the entanglement matrix. The maximum number of oscillators is 8. If fewer oscillators are enabled, array sizes shrink accordingly (only active oscillators are processed).
Matrix Indexing : The entanglement matrix is stored as a flat array with size N×N, where N is the number of active oscillators. Index mapping: index(row, col) = row × N + col. Symmetric pairs (i,j) and (j,i) are stored identically.
Normalization Stability : Oscillators are normalized to using fixed reference levels (e.g., RSI overbought/oversold at 70/30). For unbounded oscillators (MACD, ROC, TSI), statistical normalization (division by rolling standard deviation) is used, with clamping to prevent extreme outliers from distorting phase calculations.
Smoothing and Lag : The CI smoothing window (SMA) introduces lag proportional to the window size. This is intentional—it filters out single-bar noise spikes in coherence. Users requiring faster reaction can reduce the smoothing window to 1-2 bars, at the cost of increased sensitivity to noise.
Complex Number Representation : Pine Script does not have native complex number types. Complex arithmetic is implemented using separate real and imaginary accumulators (sum_cos, sum_sin) and manual calculation of magnitude (sqrt(real² + imag²)) and argument (atan2(imag, real)).
Lookback Limits : The indicator respects Pine Script's maximum lookback constraints. Historical phase and amplitude values are accessed using the operator, with lookback limited to the chart's available bar history (max_bars_back=5000 declared).
Visual Rendering Performance : Tables (orbit plot, heat map, web, dashboard) are conditionally deleted and recreated on each update using table.delete() and table.new(). This prevents memory leaks but incurs redraw overhead. Rendering is restricted to barstate.islast (last bar) to minimize computational load—historical bars do not render visuals.
Alert Condition Triggers : alertcondition() functions evaluate on bar close when their boolean conditions transition from false to true. Alerts do not fire repeatedly while a condition remains true (e.g., CI stays above threshold for 10 bars fires only once on the initial cross).
Color Gradient Functions : The phaseColor() function maps phase angles to RGB hues using sine waves offset by 120° (red, green, blue channels). This creates a continuous spectrum where -180° to +180° spans the full color wheel. The amplitudeColor() function maps amplitude to grayscale intensity. The coherenceColor() function uses cos(phase) to map contribution to CI (positive = green, negative = red).
No External Data Requests : QRFM operates entirely on the chart's symbol and timeframe. It does not use request.security() or access external data sources. All calculations are self-contained, avoiding lookahead bias from higher-timeframe requests.
Deterministic Behavior : Given identical input parameters and price data, QRFM produces identical outputs. There are no random elements, probabilistic sampling, or time-of-day dependencies.
— Dskyz, Engineering precision. Trading coherence.

Profit Guard ProProfitGuard Pro
ProfitGuard Pro is a risk management and profit calculation tool that helps traders optimize their trades by handling position sizing, risk management, leverage, and take profit calculations. With support for both cumulative and non-cumulative take profit strategies, this versatile indicator provides the insights you need to maximize your trading strategy.
How to Use ProfitGuard Pro:
Load the Indicator: Add ProfitGuard Pro to your chart in TradingView.
Set Your Entry Position: Input your desired entry price.
Define Your Stop Loss: Enter the price at which your trade will exit to minimize losses.
Add Take Profit Levels: Input your TP1, TP2, TP3, and TP4 levels, as needed.
If you want fewer take profit levels, adjust the number of TPs in the settings menu. You can choose between 1 to 4 take profit levels based on your strategy.
Adjust Risk Settings: Specify your account size and risk percentage to calculate position size and leverage.
Choose Cumulative or Non-Cumulative Mode: Toggle cumulative profit mode to either recalculate position sizes as each take profit is hit or keep position sizes static for each TP.
Once set up, ProfitGuard Pro will automatically calculate your position size, leverage, and potential profits for each take profit level, providing a clear visual on your chart to guide your trading decisions.
Key Features:
Risk Management:
Calculate your risk percentage based on account size and stop loss.
Visualize risk in dollar terms and percentage of your account.
Position Size & Leverage:
Automatically calculate the ideal position size and leverage for your trade based on your entry, stop loss, and risk settings.
Ensure you are trading with the appropriate leverage for your account size.
Cumulative vs Non-Cumulative Profit Mode:
Cumulative Mode: Adjusts position size after each take profit is reached, recalculating for remaining contracts.
Non-Cumulative Mode: Treats each take profit as a separate calculation using the full position size.
Take Profit Levels:
Set up to 4 customizable take profit levels.
Adjust percentage values for each TP target, and visualize them on your chart with easy-to-read lines.
Profit Calculation:
Displays potential profits for each take profit level based on whether cumulative or non-cumulative mode is selected.
Calculate your risk-reward ratio dynamically at each TP.
Customizable Visuals:
Easily customize the table's size, position, and color scheme to fit your chart.
Visualize key trade details like leverage, contracts, margin, and profits directly on your chart.
Short and Long Position Support:
Automatically adjusts calculations based on whether you're trading long or short.

FVG Visual Trading ToolHow to Use the FVG Tool
1. Identify the FVG Zone
Bullish FVG: Look for green boxes that represent potential support zones. These are areas where price is likely to retrace before continuing upward.
Bearish FVG: Look for red boxes that represent potential resistance zones. These are areas where price is likely to retrace before continuing downward.
2. Set Up Your Trade
Entry: Place a limit order at the retracement zone (inside the FVG box). This ensures you enter the trade when the price retraces into the imbalance.
Stop-Loss (SL): Place your stop-loss just below the FVG box for bullish trades or just above the FVG box for bearish trades. The tool provides a suggested SL level.
Take-Profit (TP): Set your take-profit level at a 2:1 risk-reward ratio (or higher). The tool provides a suggested target level.
3. Let the Trade Run
Once your trade is set up, let it play out. Avoid micromanaging the trade unless market conditions change drastically.
Step-by-Step Example
Bullish FVG Trade
Identify the FVG:
A green box appears, indicating a bullish FVG.
The tool provides the target price (e.g., 0.6371) and the stop-loss level (e.g., 0.6339).
Set Up the Trade:
Place a limit buy order at the retracement zone (inside the green box).
Set your stop-loss just below the FVG box (e.g., 0.6339).
Set your take-profit at a 2:1 risk-reward ratio or the suggested target (e.g., 0.6371).
Monitor the Trade:
Wait for the price to retrace into the FVG zone and trigger your limit order.
Let the trade run until it hits the take-profit or stop-loss.
Bearish FVG Trade
Identify the FVG:
A red box appears, indicating a bearish FVG.
The tool provides the target price and the stop-loss level.
Set Up the Trade:
Place a limit sell order at the retracement zone (inside the red box).
Set your stop-loss just above the FVG box.
Set your take-profit at a 2:1 risk-reward ratio or the suggested target.
Monitor the Trade:
Wait for the price to retrace into the FVG zone and trigger your limit order.
Let the trade run until it hits the take-profit or stop-loss.
Key Features of the Tool in Action
Visual Clarity:
The green and red boxes clearly show the FVG zones, making it easy to identify potential trade setups.
Labels provide the target price and stop-loss level for quick decision-making.
Risk-Reward Management:
The tool encourages disciplined trading by providing predefined SL and TP levels.
A 2:1 risk-reward ratio ensures that profitable trades outweigh losses.
Hands-Off Execution:
By placing limit orders, you can let the trade execute automatically without needing to monitor the market constantly.
Best Practices
Trade in the Direction of the Trend:
Use higher timeframes (e.g., 4-hour or daily) to identify the overall trend.
Focus on bullish FVGs in an uptrend and bearish FVGs in a downtrend.
Combine with Confirmation Signals:
Look for additional confirmation, such as candlestick patterns (e.g., engulfing candles) or indicator signals (e.g., RSI, MACD).
Adjust Parameters for Volatility:
For highly volatile markets, consider increasing the stop-loss percentage to avoid being stopped out prematurely.
Avoid Overtrading:
Not every FVG is a good trading opportunity. Be selective and only trade setups that align with your strategy.
Backtest and Optimize:
Use historical data to test the tool and refine your approach before trading live.
Common Mistakes to Avoid
Entering Without Confirmation:
Wait for price to retrace into the FVG zone before entering a trade.
Avoid chasing trades that have already moved away from the zone.
Ignoring Risk Management:
Always use a stop-loss to protect your account.
Stick to a consistent risk-reward ratio.
Trading Against the Trend:
Avoid taking trades that go against the prevailing market trend unless there is strong evidence of a reversal.
Final Thoughts
The FVG Visual Trading Tool is a powerful aid for identifying high-probability trade setups. By following the steps outlined above, you can use the tool to trade with confidence and discipline. Remember, no tool guarantees success, so always combine it with sound trading principles and proper risk management

ChartArt-Bankniftybuying5minName: ChartArt-BankNifty Buying Strategy (5-Minute)
Timeframe: 5-Minute Candles
Asset: BankNifty (Indian Stock Market Index)
Trading Hours: 9:30 AM - 2:45 PM IST (Indian Standard Time)
This strategy is designed for BankNifty intraday traders who want to capitalize on short-term price movements within a defined trading window. It combines technical indicators like Simple Moving Averages (SMA), Relative Strength Index (RSI), and candlestick patterns to identify potential buy signals during intraday downtrends. The strategy employs specific entry, stop-loss, and target conditions to manage trades effectively and minimize risk.
Technical Indicators Used
Simple Moving Averages (SMA):
EMA7: 7-period SMA on closing price.
EMA5: 5-period SMA on closing price.
Purpose: Used to identify the intraday trend by comparing short-term moving averages. The strategy focuses on situations where the market is in a minor downtrend, indicated by EMA5 being below EMA7.
Relative Strength Index (RSI):
RSI14: 14-period RSI, a momentum oscillator that measures the speed and change of price movements.
SMA14: 14-period SMA of the RSI.
Purpose: RSI is used to identify potential reversal points. The strategy looks for situations where the RSI is below its own moving average, suggesting weakening momentum in the downtrend.
Candlestick Patterns:
Relaxed Hammer or Doji (2nd Candle): A pattern where the second candle in a 3-candle sequence shows a potential reversal signal (Hammer or Doji), indicating indecision or a potential turning point.
Bearish 1st Candle: The first candle is bearish, setting up the context for a potential reversal.
Bullish 3rd Candle: The third candle must be bullish with specific characteristics (closing near the high, surpassing the previous high), confirming the reversal.
Strategy Conditions
Time Condition:
The strategy is only active during specific hours (9:30 AM to 2:45 PM IST). This ensures that trades are only taken during the most liquid hours of the trading day, avoiding potential volatility or lack of liquidity towards market close.
Intraday Downtrend Condition:
EMA5 < EMA7: Indicates that the market is in a minor downtrend. The strategy looks for reversal opportunities within this trend.
RSI Condition:
RSI14 <= SMA14: Indicates that the current RSI value is below its 14-period SMA, suggesting potential weakening momentum, which can precede a reversal.
Candlestick Patterns:
1st Candle: Must be bearish, setting up the context for a potential reversal.
2nd Candle: Must either be a Hammer or Doji, indicating a potential reversal pattern.
3rd Candle: Must be bullish, with specific characteristics (closing near the high, breaking the previous high, etc.), confirming the reversal.
RSI Crossover Condition:
A crossover of the RSI over its SMA in the last 5 periods is also checked, adding further confirmation to the reversal signal.
Entry and Exit Rules
Entry Signal:
A buy signal is generated when all the conditions (time, intraday downtrend, bearish 1st candle, hammer/doji 2nd candle, bullish 3rd candle, and RSI condition) are met. The trade is entered at the high of the bullish third candle.
Stop Loss:
The stop loss is calculated based on the difference between the entry price and the low of the second candle. If this difference is greater than 90 points, the stop loss is placed at the midpoint of the second candle's range (average of high and low). Otherwise, it is placed at the low of the second candle.
Target 1:
The first target is set at 1.8 times the difference between the entry price and the stop loss. When this target is hit, half of the position is exited to lock in partial profits.
Target 2:
The second target is set at 3 times the difference between the entry price and the stop loss. The remaining position is exited at this point, or if the price hits the stop loss.
Originality and Usefulness
This strategy is original in its combination of multiple technical indicators and candlestick patterns to identify potential reversals in a specific intraday timeframe. By focusing on minor downtrends and utilizing a 3-candle reversal pattern, the strategy seeks to capture quick price movements with a structured approach to risk management.
Key Benefits:
High Precision: The strategy’s multi-step filtering process (time condition, trend confirmation, candlestick pattern analysis, and momentum evaluation via RSI) increases the likelihood of accurate trade signals.
Risk Management: The use of a dynamic stop-loss based on candle characteristics, combined with partial profit-taking, allows traders to lock in profits while still giving the trade room to develop further.
Structured Approach: The strategy provides a clear, rule-based system for entering and exiting trades, which can help remove emotional decision-making from the trading process.
Charts and Signals
The strategy produces signals in the form of labels on the chart:
Buy Signal: A green label is plotted below the candle that meets all entry conditions, indicating a potential buy opportunity.
Stop Loss (SL): A red dashed line is drawn at the stop-loss level with a label indicating "SL".
Target 1 (1st TG): A blue dashed line is drawn at the first target level with a label indicating "1st TG".
Target 2 (2nd TG): Another blue dashed line is drawn at the second target level with a label indicating "2nd TG".
These visual aids help traders quickly identify entry points, stop loss levels, and target levels on the chart, making the strategy easy to follow and implement.
Backtesting and Optimization
Backtesting: The strategy can be backtested on TradingView using historical data to evaluate its performance. Traders should consider testing across different market conditions to ensure the strategy's robustness.
Optimization: Parameters such as the RSI period, moving averages, and target multipliers can be optimized based on backtesting results to refine the strategy further.
Conclusion
The ChartArt-BankNifty Buying Strategy offers a well-rounded approach to intraday trading, focusing on capturing reversals in minor downtrends. With a strong emphasis on technical analysis, precise entry and exit rules, and robust risk management, this strategy provides a solid framework for traders looking to engage in intraday trading on BankNifty.

Average SL% Calculator with TP Levels by GorkiAverage Stop Loss And Take Profit Calculator For Futures Trading by Gorki
Description
The "Average SL% Calculator with TP Levels" script, is a simple tool for traders to plan the trades and check how much loss they are going to receive if they run this strategy. This script calculates the average price of up to four entry points, determines the percentage distance to the stop-loss level, and provides potential loss information based on margin and leverage. Additionally, it includes multiple take-profit levels to help traders systematically capture profits. Visual elements such as horizontal lines and labels make it easy to monitor key levels directly on the chart.
Why To Use This Indicator?
Risk Management: Automatically calculates the percentage distance to the stop-loss level, helping you to understand potential losses.
Profit Optimization: Supports up to four take-profit levels, enabling a structured approach to capturing gains.
Visual Clarity: Displays key levels and important information directly on the chart for easy monitoring.
Alerts: Generates alerts when the price crosses specified levels, ensuring you never miss critical trading signals.
How to Use the Script
Add the Script to Your Chart: Apply the script to your TradingView chart.
Set Input Values: Entry Points: Define up to four limit prices (LIMIT 1, LIMIT 2, LIMIT 3, LIMIT 4).
Stop-Loss: Set your stop-loss price (STOP LOSS).
Take Profits: Specify up to four take-profit levels (Take Profit 1, Take Profit 2, Take Profit 3, Take Profit 4).
Leverage: Input your leverage factor.
Margin: Enter the total margin amount for the trade.
View Calculations: The script will calculate the average entry price, the percentage distance to the stop-loss, and the potential loss based on margin and leverage.
Monitor Levels: Horizontal lines and labels will appear on the chart, showing entry points, stop-loss, and take-profit levels.
Set Alerts: Alerts will trigger when the price crosses your defined levels, helping you to take timely action.
Calculation Details
Average Price: Calculated as the mean of the specified limit prices.
Distance to Stop-Loss: Determined as the percentage difference between the average price and the stop-loss level.
Leveraged Distance: The stop-loss distance percentage multiplied by the leverage factor.
Potential Loss: Calculated by applying the leveraged distance percentage to the margin amount.
Take Profit Percentages: The percentage difference between the average price and each take-profit level.
This comprehensive indicator is a must-have for any trader looking to manage risks effectively while maximizing potential profits. Happy trading!

VMDM - Volume, Momentum & Divergence Master [BullByte]VMDM - Volume, Momentum and Divergence Master
Educational Multi-Layer Market Structure Analysis System
Multi-factor divergence engine that scores RSI momentum, volume pressure, and institutional footprints into one non-repainting confluence rating (0-100).
WHAT THIS INDICATOR IS
VMDM is an educational indicator designed to teach traders how to recognize high-probability reversal and continuation patterns by analyzing four independent market dimensions simultaneously. Instead of relying on a single indicator that may produce frequent false signals, VMDM creates a confluence-based scoring system that weights multiple confirmation factors, helping you understand which setups have stronger technical backing and which are lower quality.
This is NOT a trading system or signal generator. It is a learning tool that visualizes complex market structure concepts in an accessible format for both coders and non-coders.
THE PROBLEM IT SOLVES
Most traders face these common challenges:
Challenge 1 - Indicator Overload: Running RSI, volume analysis, and divergence detection separately creates chart clutter and conflicting signals. You waste time cross-referencing multiple windows trying to determine if all factors align.
Challenge 2 - False Divergences: Standard divergence indicators trigger on every minor pivot, creating noise. Many divergences fail because they lack supporting evidence from volume or market structure.
Challenge 3 - Missed Context: A bullish RSI divergence means nothing if it occurs during weak volume or in the middle of strong distribution. Context determines quality.
Challenge 4 - Repainting Confusion: Many divergence scripts repaint, showing perfect historical signals that never actually triggered in real-time, leading to false confidence.
Challenge 5 - Institutional Pattern Recognition: Absorption zones, stop hunts, and exhaustion patterns are taught in trading education but difficult to identify systematically without manual analysis.
VMDM addresses all five challenges by combining complementary analytical layers into one transparent, non-repainting, confluence-weighted system with visual clarity.
WHY THIS SPECIFIC COMBINATION - MASHUP JUSTIFICATION
This indicator is NOT a random mashup of popular indicators. Each of the four layers serves a specific analytical purpose and together they create a complete market structure assessment framework.
THE FOUR ANALYTICAL LAYERS
LAYER 1 - RSI MOMENTUM DIVERGENCE (Trend Exhaustion Detection)
Purpose: Identifies when price momentum is weakening before price itself reverses.
Why RSI: The Relative Strength Index measures momentum on a bounded 0-100 scale, making divergence detection mathematically consistent across all assets and timeframes. Unlike raw price oscillators, RSI normalizes momentum regardless of volatility regime.
How It Contributes: Divergence between price pivots and RSI pivots reveals early momentum exhaustion. A lower price low with a higher RSI low (bullish regular divergence) signals sellers are losing strength even as price makes new lows. This is the PRIMARY signal generator in VMDM.
Limitation If Used Alone: RSI divergence by itself produces many false signals because momentum can remain weak during continued trends. It needs confirmation from volume and structural evidence.
LAYER 2 - VOLUME PRESSURE ANALYSIS (Buying vs Selling Intensity)
Purpose: Quantifies whether the current bar's volume reflects buying pressure or selling pressure based on where price closed within the bar's range.
Methodology: Instead of just measuring volume size, VMDM calculates WHERE in the bar range the close occurred. A close near the high on high volume indicates strong buying absorption. A close near the low indicates selling pressure. The calculation accounts for wick size (wicks reduce pressure quality) and uses percentile ranking over a lookback period to normalize pressure strength on a 0-100 scale.
Formula Concept:
Buy Pressure = Volume × (Close - Low) / (High - Low) × Wick Quality Factor
Sell Pressure = Volume × (High - Close) / (High - Low) × Wick Quality Factor
Net Pressure = Buy Pressure - Sell Pressure
Pressure Strength = Percentile Rank of Net Pressure over lookback period
Why Percentile Ranking: Absolute volume varies by asset and session. Percentile ranking makes 85th percentile pressure on low-volume crypto comparable to 85th percentile pressure on high-volume forex.
How It Contributes: When a bullish divergence occurs at a pivot low AND pressure strength is above 60 (strong buying), this adds 25 confluence points. It confirms that the divergence is occurring during actual accumulation, not just weak selling.
Limitation If Used Alone: Pressure analysis shows current bar intensity but cannot identify trend exhaustion or reversal timing. High buying pressure can exist during a strong uptrend with no reversal imminent.
LAYER 3 - BEHAVIORAL FOOTPRINT PATTERNS (Volume Anomaly Detection)
CRITICAL DISCLAIMER: The terms "institutional footprint," "absorption," "stop hunt," and "exhaustion" used in this indicator are EDUCATIONAL LABELS for specific price and volume behavioral patterns. These patterns are detected through technical analysis of publicly available price, volume, and bar structure data. This indicator does NOT have access to actual institutional order flow, market maker data, broker stop-loss locations, or any non-public data source. These pattern names are used because they are common terminology in trading education to describe these technical behaviors. The analysis is interpretive and based on observable price action, not privileged information.
Purpose: Detect volume anomalies and price patterns that historically correlate with potential reversal zones or trend continuation failure.
Pattern Type 1 - Absorption (Labeled as "ACCUMULATION" or "DISTRIBUTION")
Detection Criteria: Volume is more than 2x the moving average AND bar range is less than 50 percent of the average bar range.
Interpretation: High volume compressed into a tight range suggests large participants are absorbing supply (accumulation) or distribution (distribution) without allowing price to move significantly. This often precedes directional moves once absorption completes.
Visual: Colored box zone highlighting the absorption area.
Pattern Type 2 - Stop Hunt (Labeled as "BULL HUNT" or "BEAR HUNT")
Detection Criteria: Price penetrates a recent 10-bar high or low by a small margin (0.2 percent), then closes back inside the range on above-average volume (1.5x+).
Interpretation: Price briefly spikes beyond recent structure (likely triggering stop losses placed just beyond obvious levels) then reverses. This is a classic false breakout pattern often seen before reversals.
Visual: Label at the wick extreme showing hunt direction.
Pattern Type 3 - Exhaustion (Labeled as "SELL EXHAUST" or "BUY EXHAUST")
Detection Criteria: Lower wick is more than 2.5x the body size with volume above 1.8x average and RSI below 35 (sell exhaustion), OR upper wick more than 2.5x body size with volume above 1.8x average and RSI above 65 (buy exhaustion).
Interpretation: Large wicks with high volume and extreme RSI suggest aggressive buying or selling was met with equally aggressive rejection. This exhaustion often marks short-term extremes.
Visual: Label showing exhaustion type.
How These Contribute: When a divergence forms at a pivot AND one of these behavioral patterns is active, the confluence score increases by 20 points. This confirms the divergence is occurring during structural anomaly activity, not just normal price flow.
Limitation If Used Alone: These patterns can occur mid-trend and do not indicate direction without momentum context. Absorption in a strong uptrend may just be continuation accumulation.
LAYER 4 - CONFLUENCE SCORING MATRIX (Quality Weighting System)
Purpose: Translate all detected conditions into a single 0-100 quality score so you can objectively compare setups.
Scoring Breakdown:
Divergence Present: +30 points (primary signal)
Pressure Confirmation: +25 points (volume supports direction)
Behavioral Footprint Active: +20 points (structural anomaly present)
RSI Extreme: +15 points (RSI below 30 or above 70 at pivot)
Volume Spike: +10 points (current volume above 1.5x average)
Maximum Possible Score: 100 points
Why These Weights: The weights reflect reliability hierarchy based on backtesting observation. Divergence is the core signal (30 points), but without volume confirmation (25 points) many fail. Behavioral patterns add meaningful context (20 points). RSI extremes and volume spikes are secondary confirmations (15 and 10 points).
Quality Tiers:
90-100: TEXTBOOK (all factors aligned)
75-89: HIGH QUALITY (strong confluence)
60-74: VALID (meets minimum threshold)
Below 60: DEVELOPING (not displayed unless threshold lowered)
How It Contributes: The confluence score allows you to filter noise. You can set your minimum quality threshold in settings. Higher thresholds (75+) show fewer but higher-quality patterns. Lower thresholds (50-60) show more patterns but include lower-confidence setups. This teaches you to distinguish strong setups from weak ones.
Limitation: Confluence scoring is historical observation-based, not predictive guarantee. A 95-point setup can still fail. The score represents technical alignment, not future certainty.
WHY THIS COMBINATION WORKS TOGETHER
Each layer addresses a limitation in the others:
RSI Divergence identifies WHEN momentum is exhausting (timing)
Volume Pressure confirms WHETHER the exhaustion is accompanied by opposite-side accumulation (confirmation)
Behavioral Footprint shows IF structural anomalies support the reversal hypothesis (context)
Confluence Scoring weights ALL factors into an objective quality metric (filtering)
Using only RSI divergence gives you timing without confirmation. Using only volume pressure gives you intensity without directional context. Using only pattern detection gives you anomalies without trend exhaustion context. Using all four together creates a complete analytical framework where each layer compensates for the others' weaknesses.
This is not a mashup for the sake of combining indicators. It is a structured analytical system where each component has a defined role in a multi-dimensional market assessment process.
HOW TO READ THE INDICATOR - VISUAL ELEMENTS GUIDE
VMDM displays up to five visual layer types. You can enable or disable each layer independently in settings under "Visual Layers."
VISUAL LAYER 1 - MARKET STRUCTURE (Pivot Points and Lines)
What You See:
Small labels at swing highs and lows marked "PH" (Pivot High) and "PL" (Pivot Low) with horizontal dashed lines extending right from each pivot.
What It Means:
These are CONFIRMED pivots, not real-time. A pivot low appears AFTER the required right-side confirmation bars pass (default 3 bars). This creates a delay but prevents repainting. The pivot only appears once it is mathematically confirmed.
The horizontal lines represent support (from pivot lows) and resistance (from pivot highs) levels where price previously found significant rejection.
Color Coding:
Green label and line: Pivot Low (potential support)
Red label and line: Pivot High (potential resistance)
How To Use:
These pivots are the foundation for divergence detection. Divergence is only calculated between confirmed pivots, ensuring all signals are non-repainting. The lines help you see historical structure levels.
VISUAL LAYER 2 - PRESSURE ZONES (Background Color)
What You See:
Subtle background color shading on bars - light green or light red tint.
What It Means:
This visualizes volume pressure strength in real-time.
Color Coding:
Light Green Background: Pressure Strength above 70 (strong buying pressure - price closing near highs on volume)
Light Red Background: Pressure Strength below 30 (strong selling pressure - price closing near lows on volume)
No Color: Neutral pressure (pressure between 30-70)
How To Use:
When a bullish divergence pattern appears during green pressure zones, it suggests the divergence is forming during accumulation. When a bearish divergence appears during red zones, distribution is occurring. Pressure zones help you filter divergences - those forming in supportive pressure environments have higher probability.
VISUAL LAYER 3 - DIVERGENCE LINES (Dotted Connectors)
What You See:
Dotted lines connecting two pivot points (either two pivot lows or two pivot highs).
What It Means:
A divergence has been detected between those two pivots. The line connects the price pivots where RSI showed opposite behavior.
Color Coding:
Bright Green Line: Bullish divergence (regular or hidden)
Bright Red Line: Bearish divergence (regular or hidden)
How To Use:
The divergence line appears ONLY after the second pivot is confirmed (delayed by right-side confirmation bars). This is intentional to prevent repainting. When you see the line appear, it means:
For Bullish Regular Divergence:
Price made a lower low (second pivot lower than first)
RSI made a higher low (RSI at second pivot higher than first)
Interpretation: Downtrend losing momentum
For Bullish Hidden Divergence:
Price made a higher low (second pivot higher than first)
RSI made a lower low (RSI at second pivot lower than first)
Interpretation: Uptrend continuation likely (pullback within uptrend)
For Bearish Regular Divergence:
Price made a higher high (second pivot higher than first)
RSI made a lower high (RSI at second pivot lower than first)
Interpretation: Uptrend losing momentum
For Bearish Hidden Divergence:
Price made a lower high (second pivot lower than first)
RSI made a higher high (RSI at second pivot higher than first)
Interpretation: Downtrend continuation likely (bounce within downtrend)
If "Show Consolidated Analysis Label" is disabled, a small label will appear on the divergence line showing the divergence type abbreviation.
VISUAL LAYER 4 - BEHAVIORAL FOOTPRINT MARKERS
What You See:
Boxes, labels, and markers at specific bars showing pattern detection.
ABSORPTION ZONES (Boxes):
Colored rectangular boxes spanning one or more bars.
Purple Box: Accumulation absorption zone (high volume, tight range, bullish close)
Red Box: Distribution absorption zone (high volume, tight range, bearish close)
If absorption continues for multiple consecutive bars, the box extends and a counter appears in the label showing how many bars the absorption lasted.
What It Means: Large volume is being absorbed without significant price movement. This often precedes directional breakouts once the absorption phase completes.
STOP HUNT MARKERS (Labels):
Small labels below or above wicks labeled "BULL HUNT" or "BEAR HUNT" (may show bar count if consecutive).
What It Means:
BULL HUNT : Price spiked below recent lows then reversed back up on volume - likely triggered sell stops before reversing
BEAR HUNT : Price spiked above recent highs then reversed back down on volume - likely triggered buy stops before reversing
EXHAUSTION MARKERS (Labels):
Labels showing "SELL EXHAUST" or "BUY EXHAUST."
What It Means:
SELL EXHAUST : Large lower wick with high volume and low RSI - aggressive selling met with strong rejection
BUY EXHAUST : Large upper wick with high volume and high RSI - aggressive buying met with strong rejection
How To Use:
These markers help you identify WHERE structural anomalies occurred. When a divergence signal appears AT THE SAME TIME as one of these patterns, the confluence score increases. You are looking for alignment - divergence + behavioral pattern + pressure confirmation = high-quality setup.
VISUAL LAYER 5 - CONSOLIDATED ANALYSIS LABEL (Main Pattern Signal)
What You See:
A large label appearing at pivot points (or in real-time mode, at current bar) containing full pattern analysis.
Label Appearance:
Depending on your "Use Compact Label Format" setting:
COMPACT MODE (Single Line):
Example: "BULLISH REGULAR | Q:HIGH QUALITY C:82"
Breakdown:
BULLISH REGULAR: Divergence type detected
Q:HIGH QUALITY: Pattern quality tier
C:82: Confluence score (82 out of 100)
FULL MODE (Multi-Line Detailed):
Example:
PATTERN DETECTED
-------------------
BULLISH REGULAR
Quality: HIGH QUALITY
Price: Lower Low
Momentum: Higher Low
Signal: Weakening Downtrend
CONFLUENCE: 82/100
-------------------
Divergence: 30
Pressure: 25
Institutional: 20
RSI Extreme: 0
Volume: 10
Breakdown:
Top section: Pattern type and quality
Middle section: Divergence explanation (what price did vs what RSI did)
Bottom section: Confluence score with itemized breakdown showing which factors contributed
Label Position:
In Confirmed modes: Label appears AT the pivot point (delayed by confirmation bars)
In Real-time mode: Label appears at current bar as conditions develop
Label Color:
Gold: Textbook quality (90+ confluence)
Green: High quality (75-89 confluence)
Blue: Valid quality (60-74 confluence)
How To Use:
This is your primary decision-making label. When it appears:
Check the divergence type (regular divergences are reversal signals, hidden divergences are continuation signals)
Review the quality tier (textbook and high quality have better historical win rates)
Examine the confluence breakdown to see which factors are present and which are missing
Look at the chart context (trend, support/resistance, timeframe)
Use this information to assess whether the setup aligns with your strategy
The label does NOT tell you to buy or sell. It tells you a technical pattern has formed and provides the quality assessment. Your trading decision must incorporate risk management, market context, and your strategy rules.
UNDERSTANDING THE THREE DETECTION MODES
VMDM offers three signal detection modes in settings to accommodate different trading styles and learning objectives.
MODE 1: "Confluence Only (Real-Time)"
How It Works: Displays signals AS THEY DEVELOP on the current bar without waiting for pivot confirmation. The system calculates confluence score from pressure, volume, RSI extremes, and behavioral patterns. Divergence signals are NOT required in this mode.
Delay: ZERO - signals appear immediately.
Use Case: Real-time scanning for high-confluence zones without divergence requirement. Useful for intraday traders who want immediate alerts when multiple factors align.
Tradeoff: More frequent signals but includes setups without confirmed divergence. Higher false signal rate. Signals can change as the bar develops (not repainting in historical bars, but current bar updates).
Visual Behavior: Labels appear at the current bar. No divergence lines unless divergence happens to be present.
MODE 2: "Divergence + Confluence (Confirmed)" - DEFAULT RECOMMENDED
How It Works: Full system engagement. Signals appear ONLY when:
A pivot is confirmed (requires right-side confirmation bars to pass)
Divergence is detected between current pivot and previous pivot
Total confluence score meets or exceeds your minimum threshold
Delay: Equal to your "Pivot Right Bars" setting (default 3 bars). This means signals appear 3 bars AFTER the actual pivot formed.
Use Case: Highest-quality, non-repainting signals for swing traders and learners who want to study confirmed pattern completion.
Tradeoff: Delayed signals. You will not receive the signal until confirmation occurs. In fast-moving markets, price may have already moved significantly by the time the signal appears.
Visual Behavior: Labels appear at the historical pivot location (in the past). Divergence lines connect the two pivots. This is the most educational mode because it shows completed, confirmed patterns.
Non-Repainting Guarantee: Yes. Once a signal appears, it never disappears or changes.
MODE 3: "Divergence + Confluence (Relaxed)"
How It Works: Same as Confirmed mode but with adaptive thresholds. If confluence is very high (10 points above threshold), the signal may appear even if some factors are weak. If divergence is present but confluence is slightly below threshold (within 10 points), it may still appear.
Delay: Same as Confirmed mode (right-side confirmation bars).
Use Case: Slightly more signals than Confirmed mode for traders willing to accept near-threshold setups.
Tradeoff: More signals but lower average quality than Confirmed mode.
Visual Behavior: Same as Confirmed mode.
DASHBOARD GUIDE - READING THE METRICS
The dashboard appears in the corner of your chart (position selectable in settings) and provides real-time market state analysis.
You can choose between four dashboard detail levels in settings: Off, Compact, Optimized (default), Full.
DASHBOARD ROW EXPLANATIONS
ROW 1 - Header Information
Left: Current symbol and timeframe
Center: "VMDM "
Right: Version number
ROW 2 - Mode and Delay
Shows which detection mode you are using and the signal delay.
Example: "CONFIRMED | Delay: 3 bars"
This reminds you that signals in confirmed mode appear 3 bars after the pivot forms.
ROW 3 - Market Regime
Format: "TREND UP HV" or "RANGING NV"
First Part - Trend State:
TREND UP: 20 EMA above 50 EMA with strong separation
TREND DOWN: 20 EMA below 50 EMA with strong separation
RANGING: EMAs close together, low trend strength
TRANSITION: Between trending and ranging states
Second Part - Volatility State:
HV: High Volatility (current ATR more than 1.3x the 50-bar average ATR)
NV: Normal Volatility (current ATR between 0.7x and 1.3x average)
LV: Low Volatility (current ATR less than 0.7x average)
Third Column: Volatility ratio (example: "1.45x" means current ATR is 1.45 times normal)
How To Use: Regime context helps you interpret signals. Reversal divergences are more reliable in ranging or transitional regimes. Continuation divergences (hidden) are more reliable in trending regimes. High volatility means wider stops may be needed.
ROW 4 - Pressure
Shows current volume pressure state.
Format: "BUYING | ██████████░░░░░░░░░"
States:
BUYING : Pressure strength above 60 (closes near highs)
SELLING : Pressure strength below 40 (closes near lows)
NEUTRAL : Pressure strength between 40-60
Bar Visualization: Each block represents 10 percentile points. A full bar (10 filled blocks) = 100th percentile pressure.
Color: Green for buying, red for selling, gray for neutral.
How To Use: When pressure aligns with divergence direction (bullish divergence during buying pressure), confluence is stronger.
ROW 5 - Volume and RSI
Format: "1.8x | RSI 68 | OB"
First Value: Current volume ratio (1.8x = volume is 1.8 times the moving average)
Second Value: Current RSI reading
Third Value: RSI state
OB: Overbought (RSI above 70)
OS: Oversold (RSI below 30)
Blank: Neutral RSI
How To Use: Volume spikes (above 1.5x) during divergence formation add confluence. RSI extremes at pivots add confluence.
ROW 6 - Behavioral Footprint
Format: "BULL HUNT | 2 bars"
Shows the most recent behavioral pattern detected and how long ago.
States:
ACCUMULATION / DISTRIBUTION: Absorption detected
BULL HUNT / BEAR HUNT: Stop hunt detected
SELL EXHAUST / BUY EXHAUST: Exhaustion detected
SCANNING: No recent pattern
NOW: Pattern is active on current bar
How To Use: When footprint activity is recent (within 50 bars) or active now, it adds context to divergence signals forming in that area.
ROW 7 - Current Pattern
Shows the divergence type currently detected (if any).
Examples: "BULLISH REGULAR", "BEARISH HIDDEN", "Scanning..."
Quality: Shows pattern quality (TEXTBOOK, HIGH QUALITY, VALID)
How To Use: This tells you what type of signal is active. Regular divergences are reversal setups. Hidden divergences are continuation setups.
ROW 8 - Session Summary
Format: "14 events | A3 H8 E3"
First Value: Total institutional events this session
Breakdown:
A: Absorption events
H: Stop hunt events
E: Exhaustion events
How To Use: High event counts suggest an active, volatile session with frequent structural anomalies. Low counts suggest quiet, orderly price action.
ROW 9 - Confluence Score (Optimized/Full mode only)
Format: "78/100 | ████████░░"
Shows current real-time confluence score even if no pattern is confirmed yet.
How To Use: Watch this in real-time to see how close you are to pattern formation. When it exceeds your threshold and divergence forms, a signal will appear (after confirmation delay).
ROW 10 - Patterns Studied (Optimized/Full mode only)
Format: "47 patterns | 12 bars ago"
First Value: Total confirmed patterns detected since chart loaded
Second Value: How many bars since the last confirmed pattern appeared
How To Use: Helps you understand pattern frequency on your selected symbol and timeframe. If many bars have passed since last pattern, market may be trending without reversal opportunities.
ROW 11 - Bull/Bear Ratio (Optimized/Full mode only)
Format: "28:19 | BULL"
Shows count of bullish vs bearish patterns detected.
Balance:
BULL: More bullish patterns detected (suggests market has had more bullish reversals/continuations)
BEAR: More bearish patterns detected
BAL: Equal counts
How To Use: Extreme imbalances can indicate directional bias in the studied period. A heavily bullish ratio in a downtrend might suggest frequent failed rallies (bearish continuation). Context matters.
ROW 12 - Volume Ratio Detail (Optimized/Full mode only)
Shows current volume vs average volume in absolute terms.
Example: "1.4x | 45230 / 32300"
How To Use: Confirms whether current activity is above or below normal.
ROW 13 - Last Institutional Event (Full mode only)
Shows the most recent institutional pattern type and how many bars ago it occurred.
Example: "DISTRIBUTION | 23 bars"
How To Use: Tracks recency of last anomaly for context.
SETTINGS GUIDE - EVERY PARAMETER EXPLAINED
PERFORMANCE SECTION
Enable All Visuals (Master Toggle)
Default: ON
What It Does: Master kill switch for ALL visual elements (labels, lines, boxes, background colors, dashboard). When OFF, only plot outputs remain (invisible unless you open data window).
When To Change: Turn OFF on mobile devices, 1-second charts, or slow computers to improve performance. You can still receive alerts even with visuals disabled.
Impact: Dramatic performance improvement when OFF, but you lose all visual feedback.
Maximum Object History
Default: 50 | Range: 10-100
What It Does: Limits how many of each object type (labels, lines, boxes) are kept in memory. Older objects beyond this limit are deleted.
When To Change: Lower to 20-30 on fast timeframes (1-minute charts) to prevent slowdown. Increase to 100 on daily charts if you want more historical pattern visibility.
Impact: Lower values = better performance but less historical visibility. Higher values = more history visible but potential slowdown on fast timeframes.
Alert Cooldown (Bars)
Default: 5 | Range: 1-50
What It Does: Minimum number of bars that must pass before another alert of the same type can fire. Prevents alert spam when multiple patterns form in quick succession.
When To Change: Increase to 20+ on 1-minute charts to reduce noise. Decrease to 1-2 on daily charts if you want every pattern alerted.
Impact: Higher cooldown = fewer alerts. Lower cooldown = more alerts.
USER EXPERIENCE SECTION
Show Enhanced Tooltips
Default: ON
What It Does: Enables detailed hover-over tooltips on labels and visual elements.
When To Change: Turn OFF if you encounter Pine Script compilation errors related to tooltip arguments (rare, platform-specific issue).
Impact: Minimal. Just adds helpful hover text.
MARKET STRUCTURE DETECTION SECTION
Pivot Left Bars
Default: 3 | Range: 2-10
What It Does: Number of bars to the LEFT of the center bar that must be higher (for pivot low) or lower (for pivot high) than the center bar for a pivot to be valid.
Example: With value 3, a pivot low requires the center bar's low to be lower than the 3 bars to its left.
When To Change:
Increase to 5-7 on noisy timeframes (1-minute charts) to filter insignificant pivots
Decrease to 2 on slow timeframes (daily charts) to catch more pivots
Impact: Higher values = fewer, more significant pivots = fewer signals. Lower values = more frequent pivots = more signals but more noise.
Pivot Right Bars
Default: 3 | Range: 2-10
What It Does: Number of bars to the RIGHT of the center bar that must pass for confirmation. This creates the non-repainting delay.
Example: With value 3, a pivot is confirmed 3 bars AFTER it forms.
When To Change:
Increase to 5-7 for slower, more confirmed signals (better for swing trading)
Decrease to 2 for faster signals (better for intraday, but still non-repainting)
Impact: Higher values = longer delay but more reliable confirmation. Lower values = faster signals but less confirmation. This setting directly controls your signal delay in Confirmed and Relaxed modes.
Minimum Confluence Score
Default: 60 | Range: 40-95
What It Does: The threshold score required for a pattern to be displayed. Patterns with confluence scores below this threshold are not shown.
When To Change:
Increase to 75+ if you only want high-quality textbook setups (fewer signals)
Decrease to 50-55 if you want to see more developing patterns (more signals, lower average quality)
Impact: This is your primary signal filter. Higher threshold = fewer, higher-quality signals. Lower threshold = more signals but includes weaker setups. Recommended starting point is 60-65.
TECHNICAL PERIODS SECTION
RSI Period
Default: 14 | Range: 5-50
What It Does: Lookback period for RSI calculation.
When To Change:
Decrease to 9-10 for faster, more sensitive RSI that detects shorter-term momentum changes
Increase to 21-28 for slower, smoother RSI that filters noise
Impact: Lower values make RSI more volatile (more frequent extremes and divergences). Higher values make RSI smoother (fewer but more significant divergences). 14 is industry standard.
Volume Moving Average Period
Default: 20 | Range: 10-200
What It Does: Lookback period for calculating average volume. Current volume is compared to this average to determine volume ratio.
When To Change:
Decrease to 10-14 for shorter-term volume comparison (more sensitive to recent volume changes)
Increase to 50-100 for longer-term volume comparison (smoother, less sensitive)
Impact: Lower values make volume ratio more volatile. Higher values make it more stable. 20 is standard.
ATR Period
Default: 14 | Range: 5-100
What It Does: Lookback period for Average True Range calculation used for volatility measurement and label positioning.
When To Change: Rarely needs adjustment. Use 7-10 for faster volatility response, 21-28 for slower.
Impact: Affects volatility ratio calculation and visual label spacing. Minimal impact on signals.
Pressure Percentile Lookback
Default: 50 | Range: 10-300
What It Does: Lookback period for calculating volume pressure percentile ranking. Your current pressure is ranked against the pressure of the last X bars.
When To Change:
Decrease to 20-30 for shorter-term pressure context (more responsive to recent changes)
Increase to 100-200 for longer-term pressure context (smoother rankings)
Impact: Lower values make pressure strength more sensitive to recent bars. Higher values provide more stable, long-term pressure assessment. Capped at 300 for performance reasons.
SIGNAL DETECTION SECTION
Signal Detection Mode
Default: "Divergence + Confluence (Confirmed)"
Options:
Confluence Only (Real-time)
Divergence + Confluence (Confirmed)
Divergence + Confluence (Relaxed)
What It Does: Selects which detection logic mode to use (see "Understanding The Three Detection Modes" section above).
When To Change: Use Confirmed for learning and non-repainting signals. Use Real-time for live scanning without divergence requirement. Use Relaxed for slightly more signals than Confirmed.
Impact: Fundamentally changes when and how signals appear.
VISUAL LAYERS SECTION
All toggles default to ON. Each controls visibility of one visual layer:
Show Market Structure: Pivot markers and support/resistance lines
Show Pressure Zones: Background color shading
Show Divergence Lines: Dotted lines connecting pivots
Show Institutional Footprint Markers: Absorption boxes, hunt labels, exhaustion labels
Show Consolidated Analysis Label: Main pattern detection label
Use Compact Label Format
Default: OFF
What It Does: Switches consolidated label between single-line compact format and multi-line detailed format.
When To Change: Turn ON if you find full labels too large or distracting.
Impact: Visual clarity vs. information density tradeoff.
DASHBOARD SECTION
Dashboard Mode
Default: "Optimized"
Options: Off, Compact, Optimized, Full
What It Does: Controls how much information the dashboard displays.
Off: No dashboard
Compact: 8 rows (essential metrics only)
Optimized: 12 rows (recommended balance)
Full: 13 rows (every available metric)
Dashboard Position
Default: "Top Right"
Options: Top Right, Top Left, Bottom Right, Bottom Left
What It Does: Screen corner where dashboard appears.
HOW TO USE VMDM - PRACTICAL WORKFLOW
STEP 1 - INITIAL SETUP
Add VMDM to your chart
Select your detection mode (Confirmed recommended for learning)
Set your minimum confluence score (start with 60-65)
Adjust pivot parameters if needed (default 3/3 is good for most timeframes)
Enable the visual layers you want to see
STEP 2 - CHART ANALYSIS
Let the indicator load and analyze historical data
Review the patterns that appear historically
Examine the confluence scores - notice which patterns had higher scores
Observe which patterns occurred during supportive pressure zones
Notice the divergence line connections - understand what price vs RSI did
STEP 3 - PATTERN RECOGNITION LEARNING
When a consolidated analysis label appears:
Read the divergence type (regular or hidden, bullish or bearish)
Check the quality tier (textbook, high quality, or valid)
Review the confluence breakdown - which factors contributed
Look at the chart context - where is price relative to structure, trend, etc.
Observe the behavioral footprint markers nearby - do they support the pattern
STEP 4 - REAL-TIME MONITORING
Watch the dashboard for real-time regime and pressure state
Monitor the current confluence score in the dashboard
When it approaches your threshold, be alert for potential pattern formation
When a new pattern appears (after confirmation delay), evaluate it using the workflow above
Use your trading strategy rules to decide if the setup aligns with your criteria
STEP 5 - POST-PATTERN OBSERVATION
After a pattern appears:
Mark the level on your chart
Observe what price does after the pattern completes
Did price respect the reversal/continuation signal
What was the confluence score of patterns that worked vs. those that failed
Learn which quality tiers and confluence levels produce better results on your specific symbol and timeframe
RECOMMENDED TIMEFRAMES AND ASSET CLASSES
VMDM is timeframe-agnostic and works on any asset with volume data. However, optimal performance varies:
BEST TIMEFRAMES
15-Minute to 1-Hour: Ideal balance of signal frequency and reliability. Pivot confirmation delay is acceptable. Sufficient volume data for pressure analysis.
4-Hour to Daily: Excellent for swing trading. Very high-quality signals. Lower frequency but higher significance. Recommended for learning because patterns are clearer.
1-Minute to 5-Minute: Works but requires adjustment. Increase pivot bars to 5-7 for filtering. Decrease max object history to 30 for performance. Expect more noise.
Weekly/Monthly: Works but very infrequent signals. Increase confluence threshold to 70+ to ensure only major patterns appear.
BEST ASSET CLASSES
Forex Majors: Excellent volume data and clear trends. Pressure analysis works well.
Crypto (Major Pairs): Good volume data. High volatility makes divergences more pronounced. Works very well.
Stock Indices (SPY, QQQ, etc.): Excellent. Clean price action and reliable volume.
Individual Stocks: Works well on high-volume stocks. Low-volume stocks may produce unreliable pressure readings.
Commodities (Gold, Oil, etc.): Works well. Clear trends and reactions.
WHAT THIS INDICATOR CANNOT DO - LIMITATIONS
LIMITATION 1 - It Does Not Predict The Future
VMDM identifies when technical conditions align historically associated with potential reversals or continuations. It does not predict what will happen next. A textbook 95-confluence pattern can still fail if fundamental events, news, or larger timeframe structure override the setup.
LIMITATION 2 - Confirmation Delay Means You Miss Early Entry
In Confirmed and Relaxed modes, the non-repainting design means you receive signals AFTER the pivot is confirmed. Price may have already moved significantly by the time you receive the signal. This is the tradeoff for non-repainting reliability. You can use Real-time mode for faster signals but sacrifice divergence confirmation.
LIMITATION 3 - It Does Not Tell You Position Sizing or Risk Management
VMDM provides technical pattern analysis. It does not calculate stop loss levels, take profit targets, or position sizing. You must apply your own risk management rules. Never risk more than you can afford to lose based on a technical signal.
LIMITATION 4 - Volume Pressure Analysis Requires Reliable Volume Data
On assets with thin volume or unreliable volume reporting, pressure analysis may be inaccurate. Stick to major liquid assets with consistent volume data.
LIMITATION 5 - It Cannot Detect Fundamental Events
VMDM is purely technical. It cannot predict earnings reports, central bank decisions, geopolitical events, or other fundamental catalysts that can override technical patterns.
LIMITATION 6 - Divergence Requires Two Pivots
The indicator cannot detect divergence until at least two pivots of the same type have formed. In strong trends without pullbacks, you may go long periods without signals.
LIMITATION 7 - Institutional Pattern Names Are Interpretive
The behavioral footprint patterns are named using common trading education terminology, but they are detected through technical analysis, not actual institutional data access. The patterns are interpretations based on price and volume behavior.
CONCEPT FOUNDATION - WHY THIS APPROACH WORKS
MARKET PRINCIPLE 1 - Momentum Divergence Precedes Price Reversal
Price is the final output of market forces, but momentum (the rate of change in those forces) shifts first. When price makes a new low but the momentum behind that move is weaker (higher RSI low), it signals that sellers are losing strength even though they temporarily pushed price lower. This precedes reversal. This is a fundamental principle in technical analysis taught by Charles Dow, widely observed in market behavior.
MARKET PRINCIPLE 2 - Volume Reveals Conviction
Price can move on low volume (low conviction) or high volume (high conviction). When price makes a new low on declining volume while RSI shows improving momentum, it suggests the new low is not confirmed by participant conviction. Adding volume pressure analysis to momentum divergence adds a confirmation layer that filters false divergences.
MARKET PRINCIPLE 3 - Anomalies Mark Structural Extremes
When volume spikes significantly but range contracts (absorption), or when price spikes beyond structure then reverses (stop hunt), or when aggressive moves are met with large-wick rejection (exhaustion), these anomalies often mark short-term extremes. Combining these structural observations with momentum analysis creates context.
MARKET PRINCIPLE 4 - Confluence Improves Probability
No single technical factor is reliable in isolation. RSI divergence alone fails frequently. Volume analysis alone cannot time entries. Combining multiple independent factors into a weighted system increases the probability that observed patterns have structural significance rather than random noise.
THE EDUCATIONAL VALUE
By visualizing all four layers simultaneously and breaking down the confluence scoring transparently, VMDM teaches you to think in terms of multi-dimensional analysis rather than single-indicator reliance. Over time, you will learn to recognize these patterns manually and understand which combinations produce better results on your traded assets.
INSTITUTIONAL TERMINOLOGY - IMPORTANT CLARIFICATION
This indicator uses the following terms that are common in trading education:
Institutional Footprint
Absorption (Accumulation / Distribution)
Stop Hunt
Exhaustion
CRITICAL DISCLAIMER:
These terms are EDUCATIONAL LABELS for specific price action and volume behavior patterns detected through technical analysis of publicly available chart data (open, high, low, close, volume). This indicator does NOT have access to:
Actual institutional order flow or order book data
Market maker positions or intentions
Broker stop-loss databases
Non-public trading data
Proprietary institutional information
The patterns labeled as "institutional footprint" are interpretations based on observable price and volume behavior that educational trading literature often associates with potential large-participant activity. The detection is algorithmic pattern recognition, not privileged data access.
When this indicator identifies "absorption," it means it detected high volume within a small range - a condition that MAY indicate large orders being filled but is not confirmation of actual institutional participation.
When it identifies a "stop hunt," it means price briefly penetrated a structural level then reversed - a pattern that MAY have triggered stop losses but is not confirmation that stops were specifically targeted.
When it identifies "exhaustion," it means high volume with large rejection wicks - a pattern that MAY indicate aggressive participation meeting strong opposition but is not confirmation of institutional involvement.
These are technical analysis interpretations, not factual statements about market participant identity or intent.
DISCLAIMER AND RISK WARNING
EDUCATIONAL PURPOSE ONLY
This indicator is designed as an educational tool to help traders learn to recognize technical patterns, understand multi-factor analysis, and practice systematic market observation. It is NOT a trading system, signal service, or financial advice.
NO PERFORMANCE GUARANTEE
Past pattern behavior does not guarantee future results. A pattern that historically preceded price movement in one direction may fail in the future due to changing market conditions, fundamental events, or random variance. Confluence scores reflect historical technical alignment, not future certainty.
TRADING INVOLVES SUBSTANTIAL RISK
Trading financial instruments involves substantial risk of loss. You can lose more than your initial investment. Never trade with money you cannot afford to lose. Always use proper risk management including stop losses, position sizing, and portfolio diversification.
NO PREDICTIVE CLAIMS
This indicator does NOT predict future price movement. It identifies when technical conditions align in patterns that historically have been associated with potential reversals or continuations. Market behavior is probabilistic, not deterministic.
BACKTESTING LIMITATIONS
If you backtest trading strategies using this indicator, ensure you account for:
Realistic commission costs
Realistic slippage (difference between signal price and actual fill price)
Sufficient sample size (minimum 100 trades for statistical relevance)
Reasonable position sizing (risking no more than 1-2 percent of account per trade)
The confirmation delay inherent in the indicator (you cannot enter at the exact pivot in Confirmed mode)
Backtests that do not account for these factors will produce unrealistic results.
AUTHOR LIABILITY
The author (BullByte) is not responsible for any trading losses incurred using this indicator. By using this indicator, you acknowledge that all trading decisions are your sole responsibility and that you understand the risks involved.
NOT FINANCIAL ADVICE
Nothing in this indicator, its code, its description, or its visual outputs constitutes financial, investment, or trading advice. Consult a licensed financial advisor before making investment decisions.
FREQUENTLY ASKED QUESTIONS
Q: Why do signals appear in the past, not at the current bar
A: In Confirmed and Relaxed modes, signals appear at confirmed pivots, which requires waiting for right-side confirmation bars (default 3). This creates a delay but prevents repainting. Use Real-time mode if you want current-bar signals without pivot confirmation.
Q: Can I use this for automated trading
A: You can create alert-based automation, but understand that Confirmed mode signals appear AFTER the pivot with delay, so your entry will not be at the pivot price. Real-time mode signals can change as the current bar develops. Automation requires careful consideration of these factors.
Q: How do I know which confluence score to use
A: Start with 60. Observe which patterns work on your symbol/timeframe. If too many false signals, increase to 70-75. If too few signals, decrease to 55. Quality vs. quantity tradeoff.
Q: Do regular divergences mean I should enter a reversal trade immediately
A: No. Regular divergences indicate momentum exhaustion, which is a WARNING sign that trend may reverse, not a confirmation that it will. Use confluence score, market context, support/resistance, and your strategy rules to make entry decisions. Many divergences fail.
Q: What's the difference between regular and hidden divergence
A: Regular divergence = price and momentum move in opposite directions at extremes = potential reversal signal. Hidden divergence = price and momentum move in opposite directions during pullbacks = potential continuation signal. Hidden divergence suggests the pullback is just a correction within the larger trend.
Q: Why does the pressure zone color sometimes conflict with the divergence direction
A: Pressure is real-time current bar analysis. Divergence is confirmed pivot analysis from the past. They measure different things at different times. A bullish divergence confirmed 3 bars ago might appear during current selling pressure. This is normal.
Q: Can I use this on stocks without volume data
A: No. Volume is required for pressure analysis and behavioral pattern detection. Use only on assets with reliable volume reporting.
Q: How often should I expect signals
A: Depends on timeframe and settings. Daily charts might produce 5-10 signals per month. 1-hour charts might produce 20-30. 15-minute charts might produce 50-100. Adjust confluence threshold to control frequency.
Q: Can I modify the code
A: Yes, this is open source. You can modify for personal use. If you publish a modified version, please credit the original and ensure your publication meets TradingView guidelines.
Q: What if I disagree with a pattern's confluence score
A: The scoring weights are based on general observations and may not suit your specific strategy or asset. You can modify the code to adjust weights if you have data-driven reasons to do so.
Final Notes
VMDM - Volume, Momentum and Divergence Master is an educational multi-layer market analysis system designed to teach systematic pattern recognition through transparent, confluence-weighted signal detection. By combining RSI momentum divergence, volume pressure quantification, behavioral footprint pattern recognition, and quality scoring into a unified framework, it provides a comprehensive learning environment for understanding market structure.
Use this tool to develop your analytical skills, understand how multiple technical factors interact, and learn to distinguish high-quality setups from noise. Remember that technical analysis is probabilistic, not predictive. No indicator replaces proper education, risk management, and trading discipline.
Trade responsibly. Learn continuously. Risk only what you can afford to lose.
-BullByte

ATR Trailing Stop (Long or Short Selectable)The ATR Trailing Stop (Long or Short Selectable) will start calculating on a set date that you specify. This is great because you want to trail the price from the breakout day or even after exceeding specific price level (can be your breakeven level or even to capture more of the upside after the price target is met).
Entry price: If you act at the close of the day, you can leave this value as 0 and it will take the close of the day for the initial protective stop-loss calculation. You can choose to add a value such as the pattern boundary and in that case it will subtract the initial protective stop-loss from the pattern boundary and not the close of the day. If you use a scaling in tactic during the day (buying in tranches intraday as the breakout takes place) and your average purchase price is different than the close of the day, you can also plug that number in to calculate the initial protective stop-loss.
This is a modified version as many followers asked for ATR trailing for short setups. Now you can select the Long/Short trade setup from the drop down menu.
ATR period: You can select the ATR period. It can be 10 day, 14 day or 30 day or any ATR period of your choice.
ATR Multiplier for Stop-loss: This is the multiplier that you want to trail the price with. From the highest level price reached it will trail the price with a 3 x ATR () distance. The higher the number, the wider the trailing stop-loss. A multiplier of 1 will trail the price so close that and adverse movement can result in triggering the stop-loss.
Custom Value for First day Trailing Stop: This is my favorite part. For aggressive risk management, your initial protective stop can be smaller than what the ATR Trailing Stop will use in its calculation after entry day. In this case you can take 1xATR () or even with FX and Futures you can apply 0.5xATR() as the first day to calculate initial protective stop. The protective stop turns into a trailing stop after the first day.
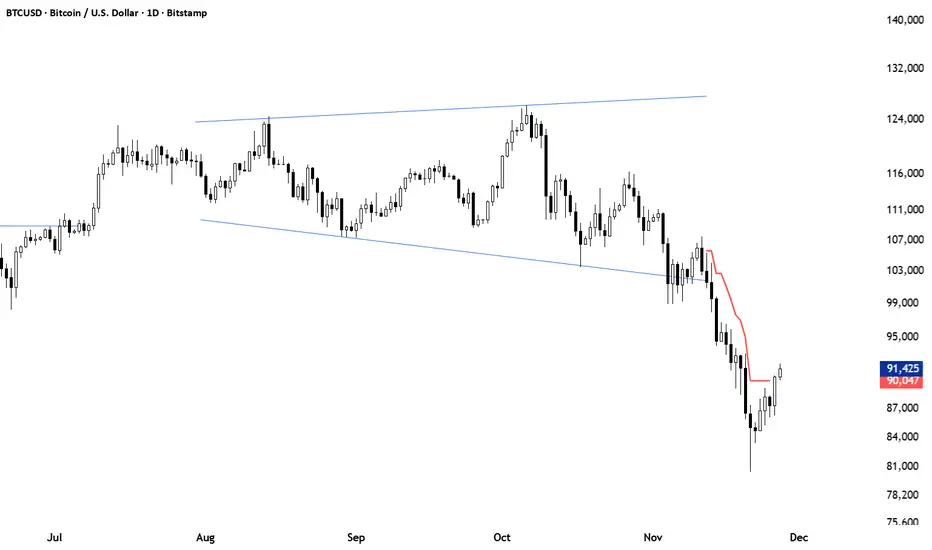
MNQ TopStep 50K | Ultra Quality v3.0MNQ TopStep 50K | Ultra Quality v3.0 - Publish Summary
📊 Overview
A professional-grade trading indicator designed specifically for MNQ futures traders using TopStep funded accounts. Combines 7 technical confirmations with 5 advanced safety filters to deliver high-quality trade signals while managing drawdown risk.
🎯 Key Features
Core Signal System
7-Point Confirmation: VWAP, EMA crossovers, 15-min HTF trend, MACD, RSI, ADX, and Volume
Signal Grading: Each signal is rated A+ through D based on 7 quality factors
Quality Threshold: Adjustable minimum grade requirement (A+, A, B, C, D)
Advanced Safety Filters (Customizable)
Mean Reversion Filter - Prevents chasing extended moves beyond VWAP bands
ATR Spike Filter - Avoids trading during extreme volatility events
EMA Spacing Filter - Ensures proper trend separation (optional)
Momentum Filter - Requires consecutive directional bars (optional)
Multi-Timeframe Confirmation - Aligns with 15-min trend (optional)
TopStep Risk Management
Real-time drawdown tracking
Position sizing calculator based on remaining cushion
Daily loss limit monitoring
Consecutive loss protection
Max trades per day limiter
Visual Components
VWAP with 1σ, 2σ, 3σ bands
EMA 9/21 with cloud fill
15-min EMA 50 for HTF trend
Comprehensive metrics dashboard
Risk management panel
Filter status panel
Detailed trade labels with entry, stops, and targets
⚙️ Default Settings (Balanced for Regular Signals)
Technical Indicators
Fast EMA: 9 | Slow EMA: 21 | HTF EMA: 50 (15-min)
MACD: 10/22/9
RSI: 14 period | Thresholds: 52 (buy) / 48 (sell)
ADX: 14 period | Minimum: 20
ATR: 14 period | Stop: 2x | TP1: 2x | TP2: 3x
Volume: 1.2x average required
Session Settings
Default: 9:30 AM - 11:30 AM ET (adjustable)
Avoids first 15 minutes after market open
Customizable trading hours
Safety Filters (Default Configuration)
✅ Mean Reversion: Enabled (2.5σ max from VWAP)
✅ ATR Spike: Enabled (2.0x threshold)
❌ EMA Spacing: Disabled (can enable for quality)
❌ Momentum: Disabled (can enable for quality)
❌ MTF Confirmation: Disabled (can enable for quality)
Risk Controls
Minimum Signal Quality: C (adjustable to A+ for fewer/better signals)
Min Bars Between Signals: 10
Max Trades Per Day: 5
Stop After Consecutive Losses: 2
📈 Expected Performance
With Default Settings:
Signals per week: 10-15 trades
Estimated win rate: 55-60%
Risk-Reward: 1:2 (TP1) and 1:3 (TP2)
With Aggressive Settings (Min Quality = D, All Filters Off):
Signals per week: 20-25 trades
Estimated win rate: 50-55%
With Conservative Settings (Min Quality = A, All Filters On):
Signals per week: 3-5 trades
Estimated win rate: 65-70%
🚀 How to Use
Basic Setup:
Add indicator to MNQ 5-minute chart
Adjust TopStep account settings in inputs
Set your risk per trade percentage (default: 0.5%)
Configure trading session hours
Set minimum signal quality (Start with C for balanced results)
Signal Interpretation:
Green Triangle (BUY): Long signal - all confirmations aligned
Red Triangle (SELL): Short signal - all confirmations aligned
Label Details: Shows entry, stop loss, take profit levels, position size, and signal grade
Signal Grade: A+ = Elite (6-7 points) | A = Strong (5) | B = Good (4) | C = Fair (3)
Dashboard Monitoring:
Top Right: Technical metrics and market conditions
Top Left: Filter status (which filters are passing/blocking)
Bottom Right: TopStep risk metrics and position sizing
⚡ Customization Tips
For More Signals:
Lower "Minimum Signal Quality" to D
Decrease ADX threshold to 18-20
Lower RSI thresholds to 50/50
Reduce Volume multiplier to 1.1x
Disable additional filters
For Higher Quality (Fewer Signals):
Raise "Minimum Signal Quality" to A or A+
Increase ADX threshold to 25-30
Enable all 5 advanced filters
Tighten VWAP distance to 2.0σ
Increase momentum requirement to 3-4 bars
For TopStep Compliance:
Adjust "Max Total Drawdown" and "Daily Loss Limit" to match your account
Update "Already Used Drawdown" daily
Monitor the Risk Panel for cushion remaining
Use recommended contract sizing
🛡️ Risk Disclaimer
IMPORTANT: This indicator is for educational and informational purposes only.
Past performance does not guarantee future results
All trading involves substantial risk of loss
Use proper risk management and position sizing
Test thoroughly in paper trading before live use
The indicator does not guarantee profitable trades
Adjust settings based on your risk tolerance and trading style
Always comply with your broker's and TopStep's rules

MNQ TopStep 50K | Ultra Quality v3.0MNQ TopStep 50K | Ultra Quality v3.0 - Publish Summary📊 OverviewA professional-grade trading indicator designed specifically for MNQ futures traders using TopStep funded accounts. Combines 7 technical confirmations with 5 advanced safety filters to deliver high-quality trade signals while managing drawdown risk.🎯 Key FeaturesCore Signal System
7-Point Confirmation: VWAP, EMA crossovers, 15-min HTF trend, MACD, RSI, ADX, and Volume
Signal Grading: Each signal is rated A+ through D based on 7 quality factors
Quality Threshold: Adjustable minimum grade requirement (A+, A, B, C, D)
Advanced Safety Filters (Customizable)
Mean Reversion Filter - Prevents chasing extended moves beyond VWAP bands
ATR Spike Filter - Avoids trading during extreme volatility events
EMA Spacing Filter - Ensures proper trend separation (optional)
Momentum Filter - Requires consecutive directional bars (optional)
Multi-Timeframe Confirmation - Aligns with 15-min trend (optional)
TopStep Risk Management
Real-time drawdown tracking
Position sizing calculator based on remaining cushion
Daily loss limit monitoring
Consecutive loss protection
Max trades per day limiter
Visual Components
VWAP with 1σ, 2σ, 3σ bands
EMA 9/21 with cloud fill
15-min EMA 50 for HTF trend
Comprehensive metrics dashboard
Risk management panel
Filter status panel
Detailed trade labels with entry, stops, and targets
⚙️ Default Settings (Balanced for Regular Signals)Technical Indicators
Fast EMA: 9 | Slow EMA: 21 | HTF EMA: 50 (15-min)
MACD: 10/22/9
RSI: 14 period | Thresholds: 52 (buy) / 48 (sell)
ADX: 14 period | Minimum: 20
ATR: 14 period | Stop: 2x | TP1: 2x | TP2: 3x
Volume: 1.2x average required
Session Settings
Default: 9:30 AM - 11:30 AM ET (adjustable)
Avoids first 15 minutes after market open
Customizable trading hours
Safety Filters (Default Configuration)
✅ Mean Reversion: Enabled (2.5σ max from VWAP)
✅ ATR Spike: Enabled (2.0x threshold)
❌ EMA Spacing: Disabled (can enable for quality)
❌ Momentum: Disabled (can enable for quality)
❌ MTF Confirmation: Disabled (can enable for quality)
Risk Controls
Minimum Signal Quality: C (adjustable to A+ for fewer/better signals)
Min Bars Between Signals: 10
Max Trades Per Day: 5
Stop After Consecutive Losses: 2
📈 Expected PerformanceWith Default Settings:
Signals per week: 10-15 trades
Estimated win rate: 55-60%
Risk-Reward: 1:2 (TP1) and 1:3 (TP2)
With Aggressive Settings (Min Quality = D, All Filters Off):
Signals per week: 20-25 trades
Estimated win rate: 50-55%
With Conservative Settings (Min Quality = A, All Filters On):
Signals per week: 3-5 trades
Estimated win rate: 65-70%
🚀 How to UseBasic Setup:
Add indicator to MNQ 5-minute chart
Adjust TopStep account settings in inputs
Set your risk per trade percentage (default: 0.5%)
Configure trading session hours
Set minimum signal quality (Start with C for balanced results)
Signal Interpretation:
Green Triangle (BUY): Long signal - all confirmations aligned
Red Triangle (SELL): Short signal - all confirmations aligned
Label Details: Shows entry, stop loss, take profit levels, position size, and signal grade
Signal Grade: A+ = Elite (6-7 points) | A = Strong (5) | B = Good (4) | C = Fair (3)
Dashboard Monitoring:
Top Right: Technical metrics and market conditions
Top Left: Filter status (which filters are passing/blocking)
Bottom Right: TopStep risk metrics and position sizing
⚡ Customization TipsFor More Signals:
Lower "Minimum Signal Quality" to D
Decrease ADX threshold to 18-20
Lower RSI thresholds to 50/50
Reduce Volume multiplier to 1.1x
Disable additional filters
For Higher Quality (Fewer Signals):
Raise "Minimum Signal Quality" to A or A+
Increase ADX threshold to 25-30
Enable all 5 advanced filters
Tighten VWAP distance to 2.0σ
Increase momentum requirement to 3-4 bars
For TopStep Compliance:
Adjust "Max Total Drawdown" and "Daily Loss Limit" to match your account
Update "Already Used Drawdown" daily
Monitor the Risk Panel for cushion remaining
Use recommended contract sizing
🛡️ Risk DisclaimerIMPORTANT: This indicator is for educational and informational purposes only.
Past performance does not guarantee future results
All trading involves substantial risk of loss
Use proper risk management and position sizing
Test thoroughly in paper trading before live use
The indicator does not guarantee profitable trades
Adjust settings based on your risk tolerance and trading style
Always comply with your broker's and TopStep's rules
